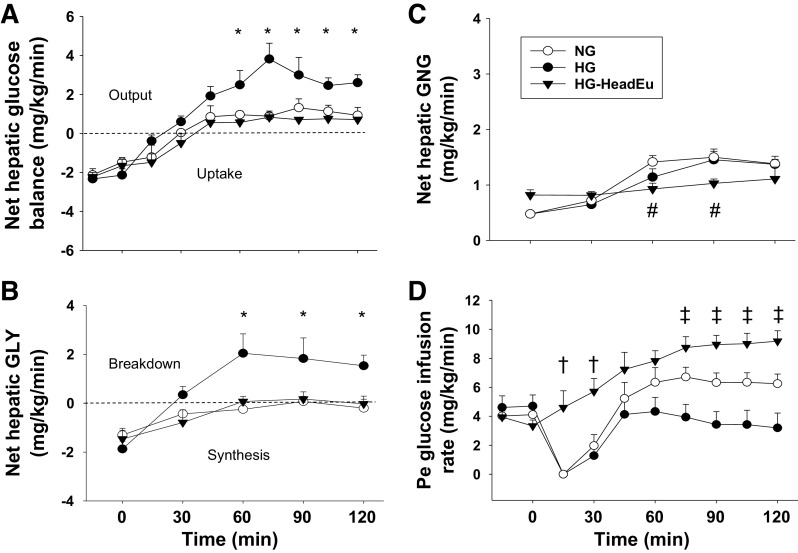
Figure 4.
Metabolic responses during the hypoglycemic experimental period. Net hepatic glucose balance (A), net hepatic glycogenolysis (GLY; B), net hepatic gluconeogenesis (GNG; C), and the peripheral (Pe) glucose infusion rate required to match the glucose levels among the groups (D). HG, intraportal (Po) infusion of fructose was used to stimulate hepatic glucose uptake; NG, saline was infused Po to maintain liver glycogen levels close to a normal, fasting level; HG-HeadEu, subset of HG group in which brain euglycemia was maintained by infusing glucose bilaterally into the carotid and vertebral arteries. *P < 0.05, HG compared with NG. #P < 0.05, HG-HeadEu compared with NG. †P < 0.05, HG-HeadEu compared with NG. ‡P < 0.05, between all 3 groups. Data were analyzed using two-way repeated measures ANOVA.

