
Figure 2.
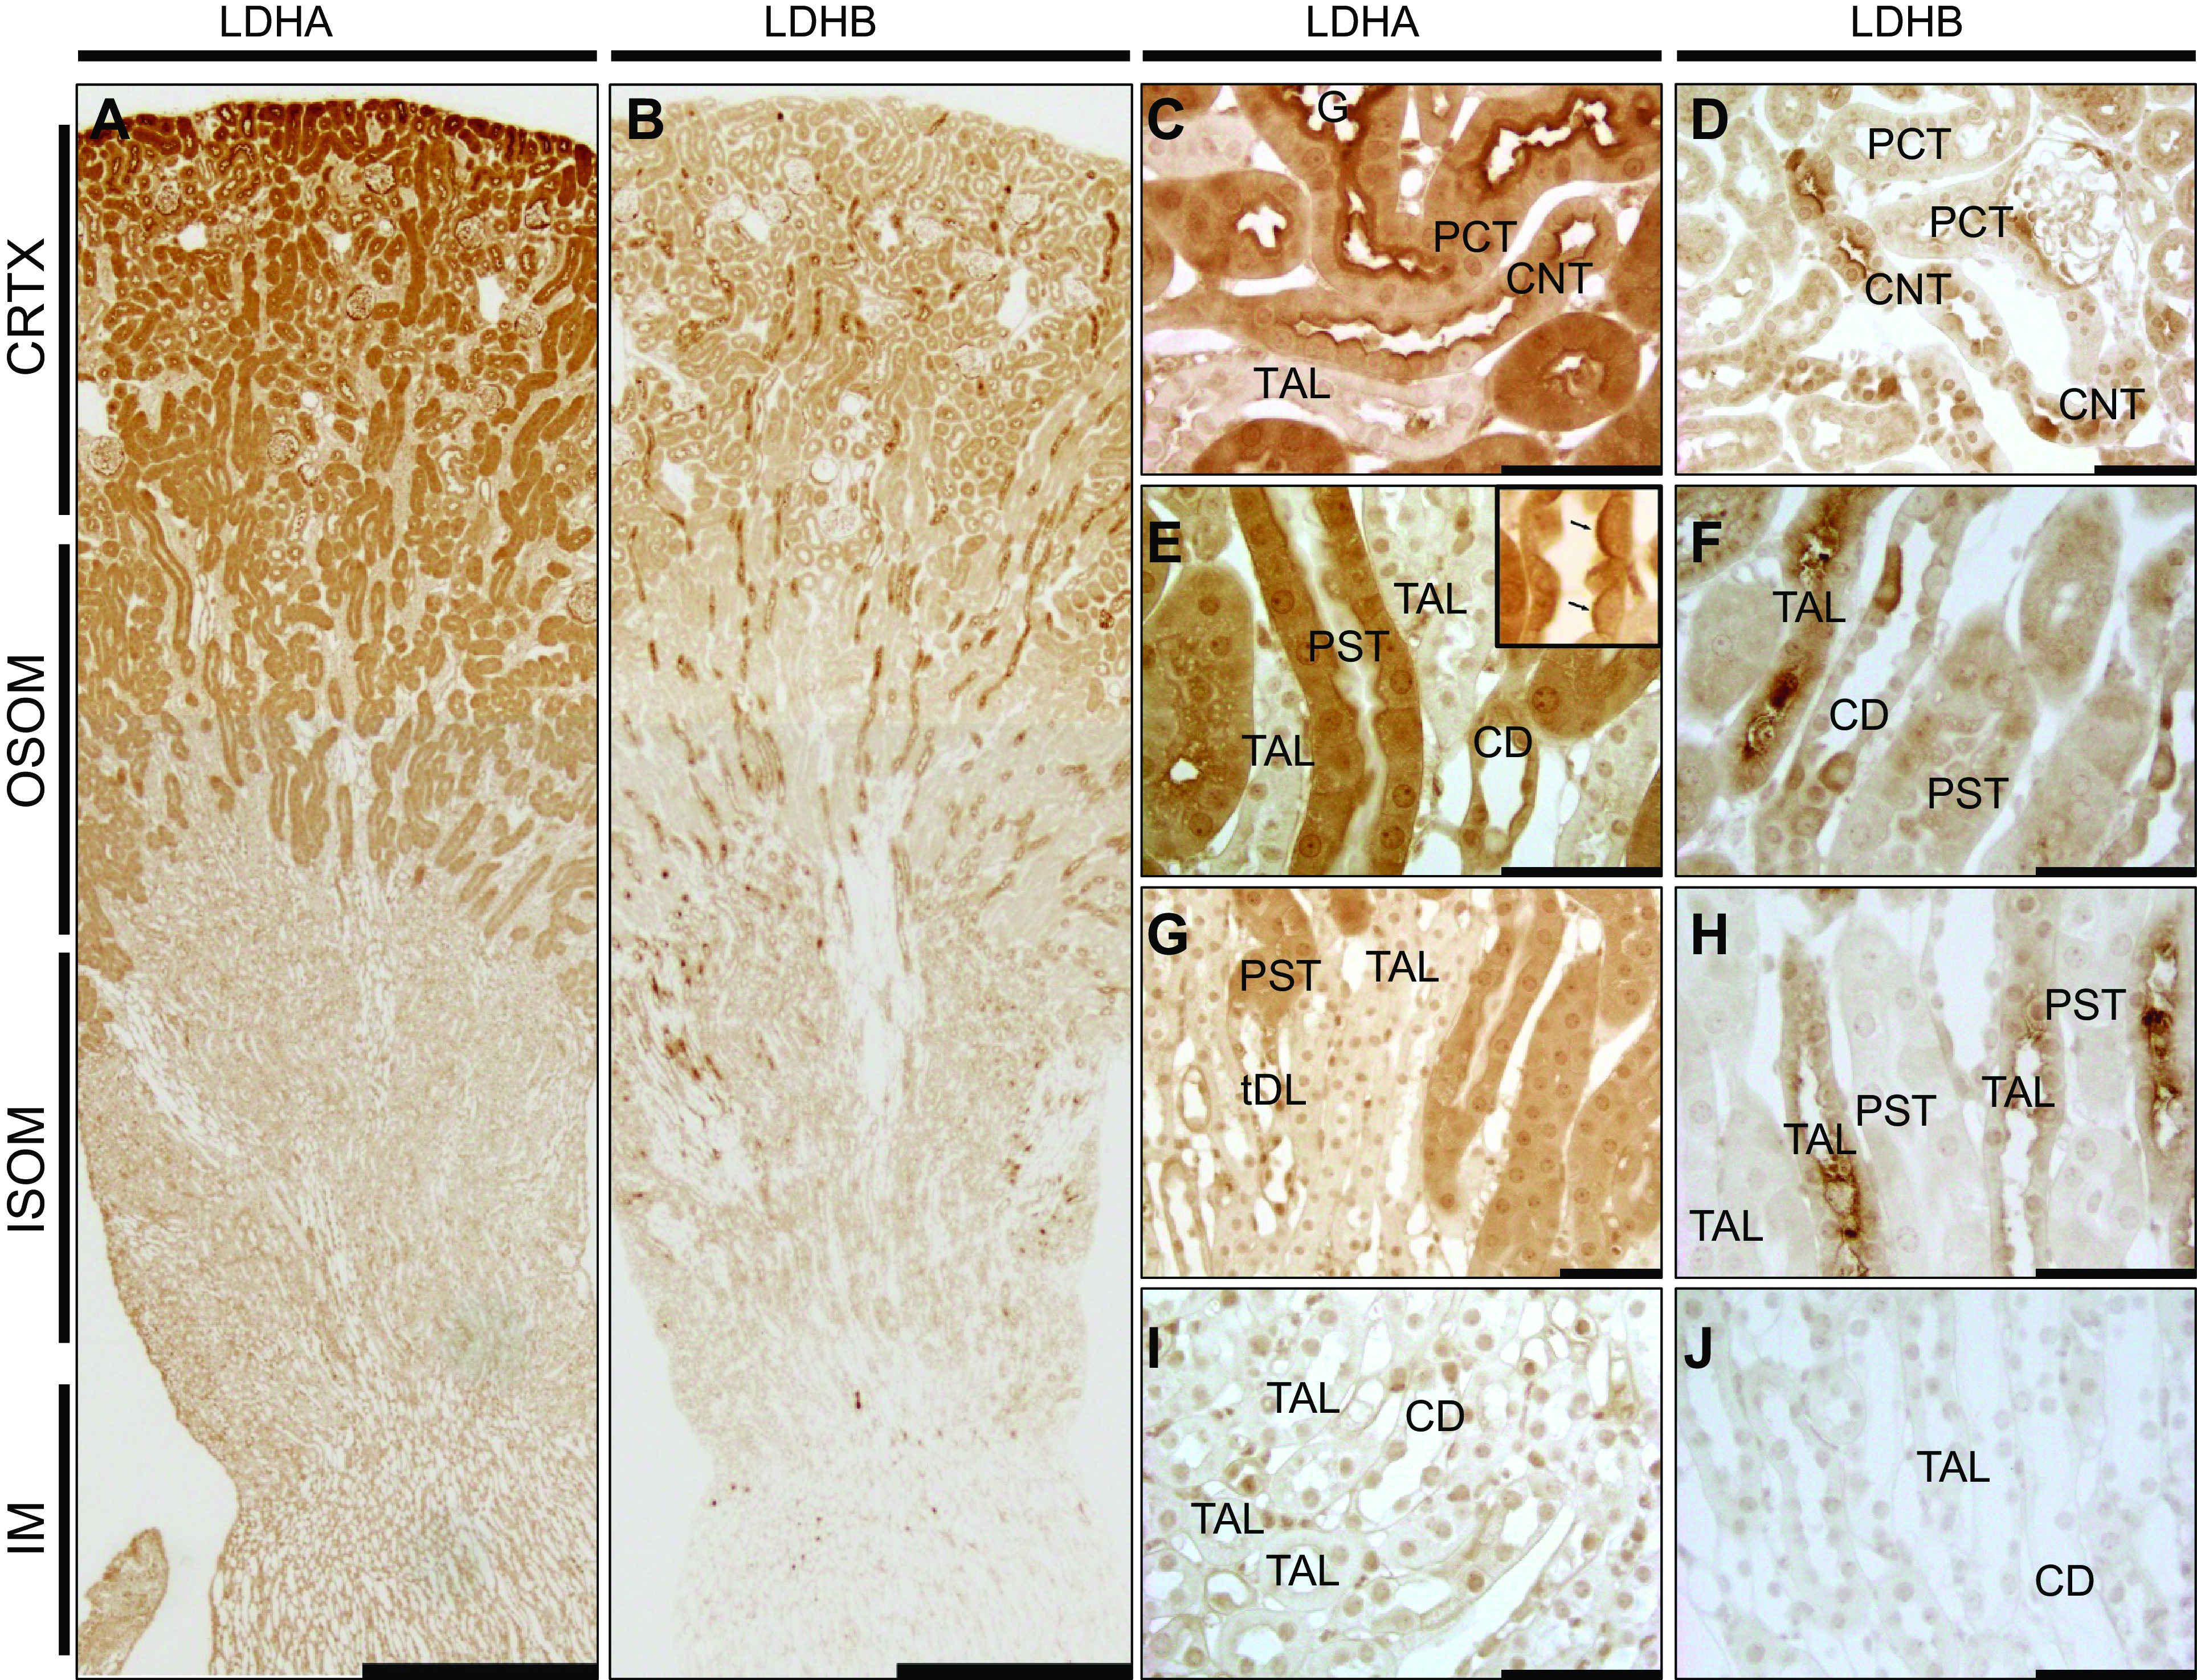
Lactate dehydrogenase (LDH) isoform A (LDHA) and LDH isoform B (LDHB) localization in the healthy mouse kidney. Immunohistochemistry for LDHA and LDHB expression in the normal mouse kidney is shown. A and B: low-power micrographs (scale bars = 500 µm) of LDHA and LDHB immunolabel, respectively. LDHA was strongest in the cortex (CRTX) and outer stripe of the outer medulla (OSOM) but was weak in the inner stripe of the outer medulla (ISOM) and inner medulla (IM). LDHB label was present in the CRTX but was strongest in medullary rays going through the ISOM. C−J: higher-power micrographs (scale bars = 50 µm) of LDHA and LDHB showing adjacent images for the CRTX (C and D), OSOM (E−H), and IM (I and J). The arrows in the inset of E points to an intercalated cell. Micrographs are representative of n = 3 animals per group. CD, collecting duct; CNT, connecting tubule; PCT, proximal convoluted tubule; PST, proximal straight tubule cell; TAL, thick ascending limb.