Figure 5.

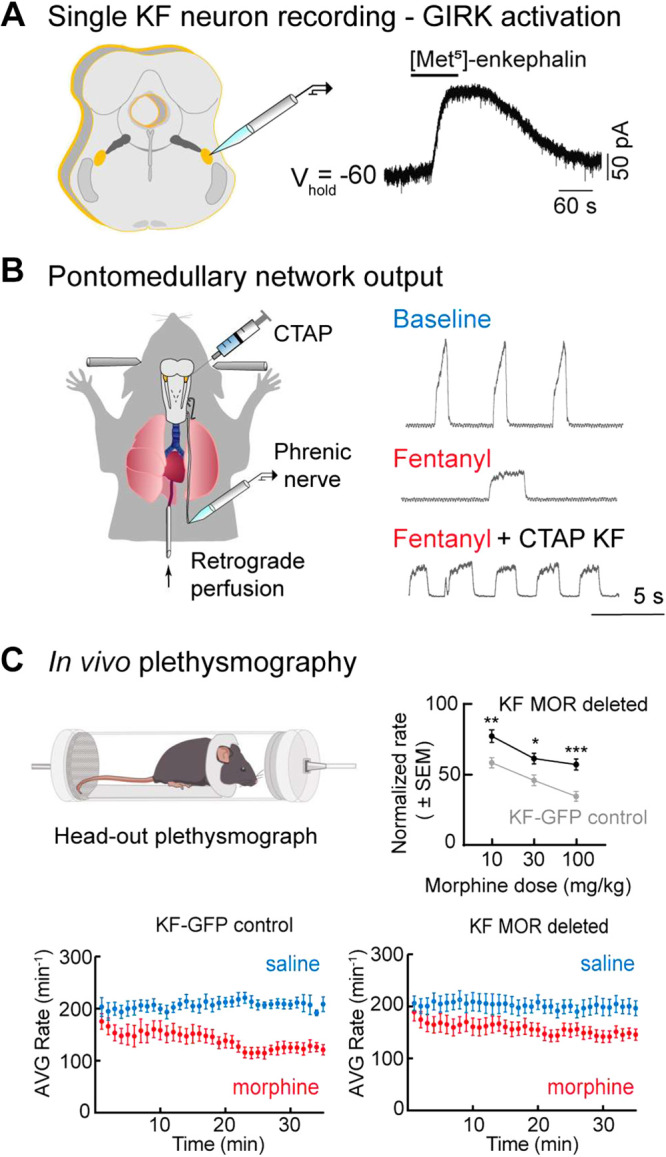
Opioid modulation of pontine networks. A: whole cell voltage-clamp recording from a KF neuron in brain slice illustrating activation of GIRK current by opioid agonist Met-enkephalin. Modified from Levitt et al. (184). B: schematic of the in situ working heart-brainstem preparation of the rat. On the right, phrenic bursts indicating inspiratory activity during baseline, following systemic fentanyl administration, and following systemic fentanyl with opioid antagonist, CTAP microinjection into the KF. Antagonism of KF MORs eliminates rate depression by fentanyl; however, the apneustic pattern characteristic of opioid effects persists. Modified from Saunders and Levitt, 2020 (211). C: schematic of in vivo plethysmograph. Graph on the top right demonstrates significant attenuation of morphine-induced respiratory rate depression in vivo following bilateral MOR deletion from KF neurons compared to control animals. Below, example time course of average respiratory rate following saline and morphine (10 mg/kg, i.p.) in control mice (left) vs. mice following MOR deletion from KF neurons (right). Modified from Varga et al. (212). GFP, green fluorescent protein; GIRK, G-protein-activated inward rectifier K+ channels; KF, Kölliker-Fuse; MOR, mu-opioid receptor. *,**,***Statistically significant (P < 0.05) in order of least to most significant.
