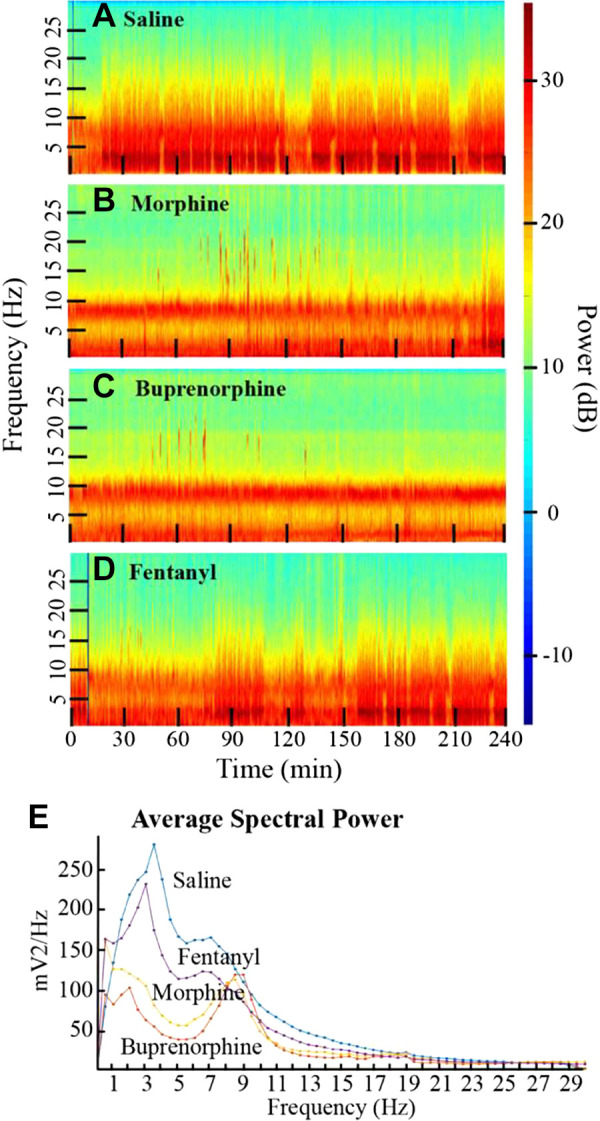
Figure 6.

Examples of how tapered spectrograms reveal that administering saline (A), morphine, (B), buprenorphine (C), or fentanyl (D) differentially changes cortical EEG power and frequency in mice. E illustrates how EEG power can be quantified to show opioid-specific alterations. These spectrograms demonstrate the importance of understanding nuanced effects of opioids on cortical excitability. Modified from O’Brien et al. (282).
