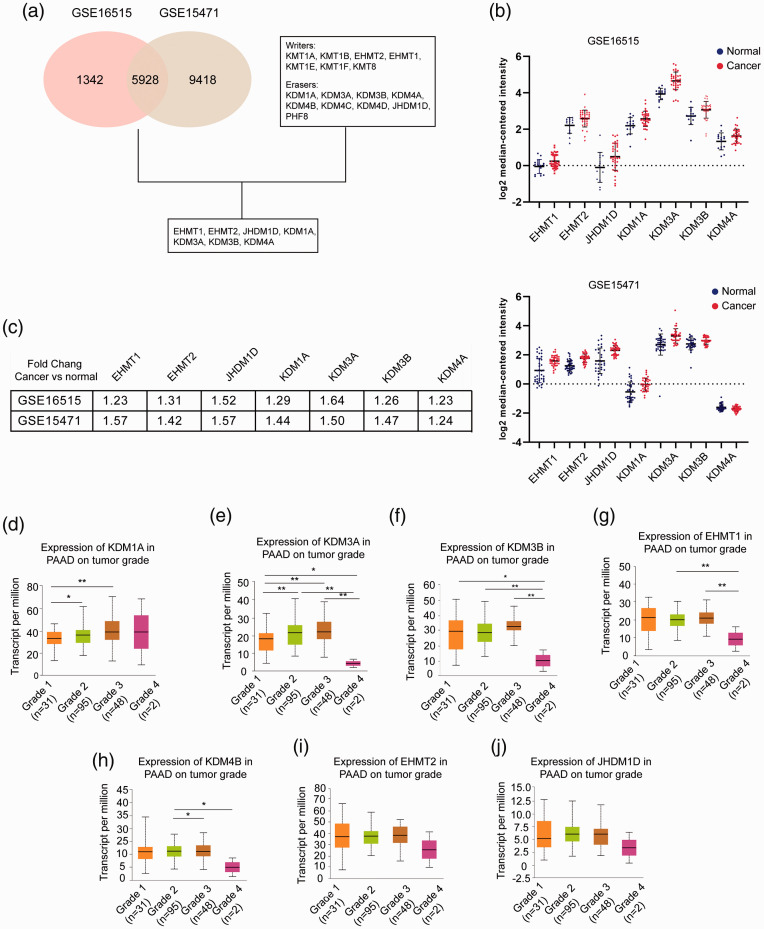
Figure 1.
Expression of H3K9 regulators in pancreatic cancer. (a) GSE16515 and GSE15471 data were derived from GEO datasets (www.ncbi.nlm.nih.gov/gds/) and analyzed by GEO2R. The cutoff value was 0.001. Writers are lysine KTMs that function at the H3K9 site, and erasers are lysine KDMs that function at the H3K9 site. (b) Scatter plots of the expression of EHMT1, EHMT2, JHDM1D, KDM1A, KDM3A, KDM3B, and KDM4A in GSE16515 (upper) and GSE15471 (lower). Blue indicates normal tissues, and red indicates cancerous tissues. The expression value for each gene was downloaded from the Oncomine database (www.oncomine.org) and is presented as the log2 median-centered ratio. (c) Summary of the fold changes of the genes in GSE16515 and GSE15471. (d–j) mRNA expression of the genes stratified by pathological grade in pancreatic cancer. Data were derived from the TCGA PAAD program. A total of 176 patients were involved, including 31 patients with grade 1 tumors, 95 patients with grade 2 tumors, 48 patients with grade 3 tumors, and 2 patients with grade 4 tumors. The mRNA level is presented as transcripts per million. *P < 0.05, **P < 0.01, ***P < 0.001. (A color version of this figure is available in the online journal.)

