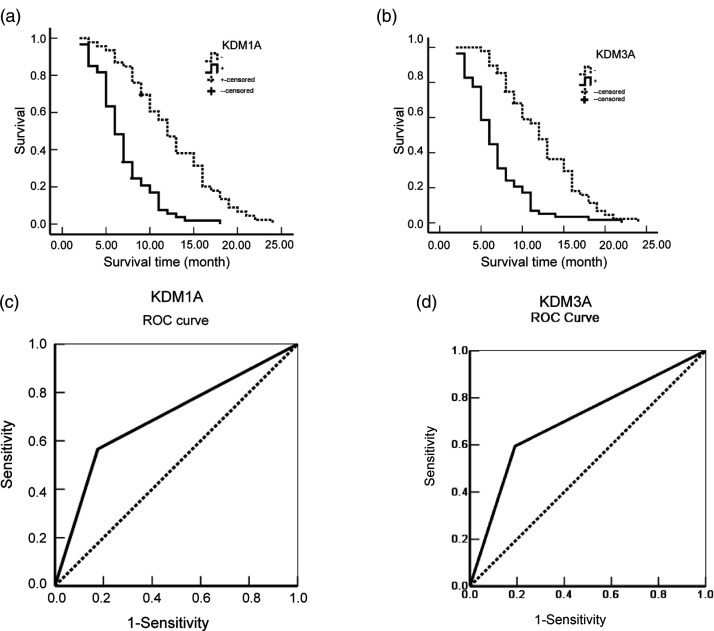
Figure 3.
KDM1A and KDM3A correlated with the prognosis of pancreatic cancer patients. (a) Kaplan–Meier plots of the overall survival period in patients with KDM1A-positive and KDM1A-negative cancers. The solid line indicates positive expression, and the dotted line indicates negative expression. (b) Kaplan–Meier plots of the overall survival period in patients with KDM3A-positive and KDM3A-negative cancers. The solid line indicates positive expression, and the dotted line indicates negative expression. (c) ROC curves were produced to assess the predictive ability of KDM1A expression in pancreatic cancer. (d) ROC curves were produced to assess the predictive ability of KDM3A expression in pancreatic cancer.

