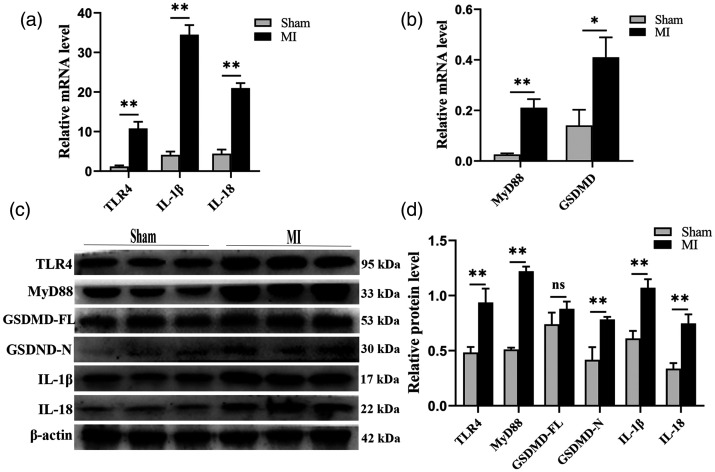
Figure 2.
Increased expression of key executive molecules of pyroptosis after MI. (a–b) Comparison of mRNAs for TLR4, MyD88, GSDMD, IL-1β, and IL-18 between the MI and sham groups. (c) Representative Western blot bands of TLR4, MyD88, GSDMD-FL, GSDMD-N, IL-1β, and IL-18. (d) Comparison of protein expression levels between the MI and sham groups. The loading control was β-actin. n = 3 per group. *P < 0.05, **P < 0.01, and ns means no statistical difference.

