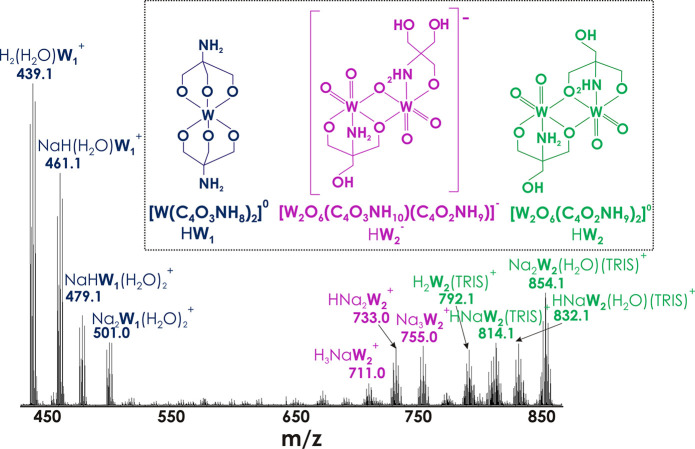
Figure 3.
ESI mass spectrum of Na2W2 in H2O (pH 6.8) recorded in the positive mode in the range from 430 to 860 m/z. Three types of species are shown in blue, purple, and green. Figure S5 shows the spectrum in the range from 100 to 1000 m/z, and Table S2 provides all species with experimental and theoretical m/z values.

