
Figure 2. Effectiveness of AIRISE-02 (siSTAT3-CpG-NP) in inducing in situ tumor vaccination in mice bearing bilateral syngeneic melanoma tumors.
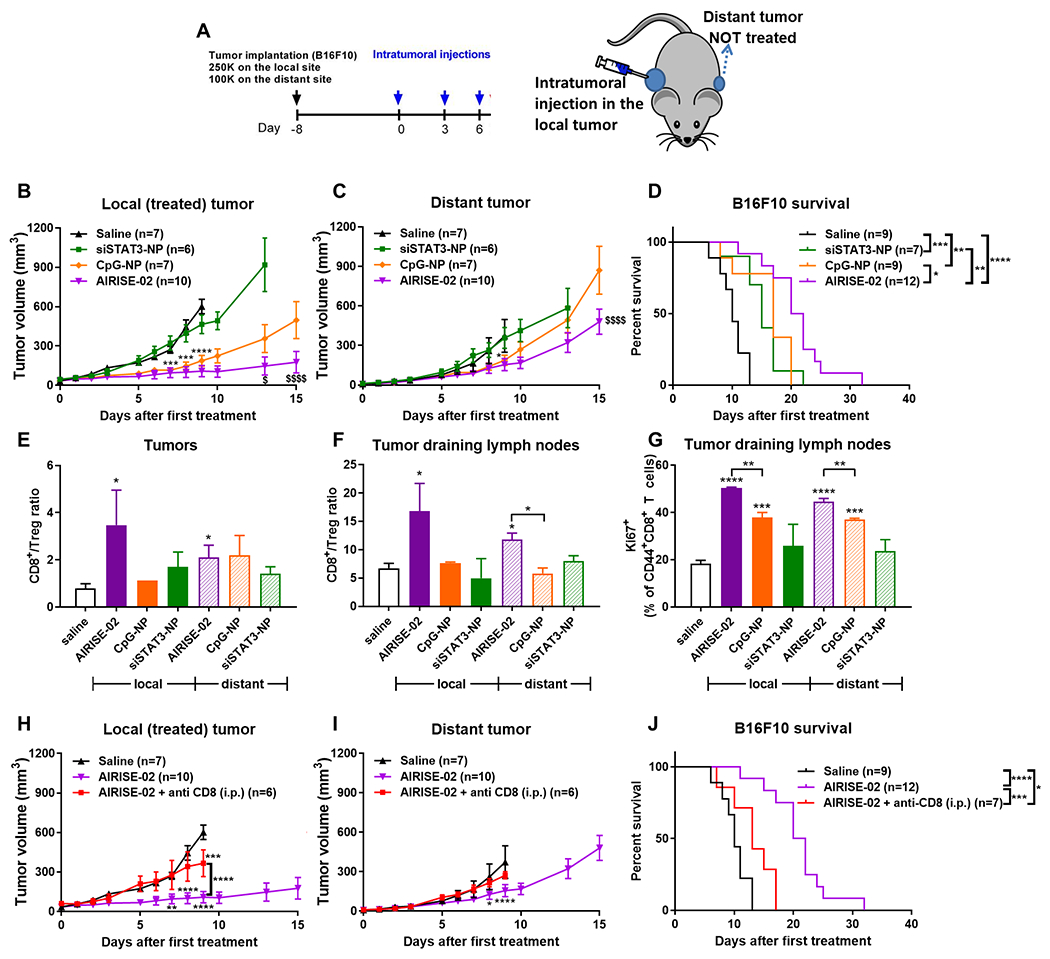
(A) C57BL/6 mice were orthotopically implanted with 250,000 and 100,000 B16F10 melanoma cells on both shoulders to model local (primary) and distant (metastatic) tumors, respectively. Eight days after tumor implantation, treatments were intratumorally injected into the local tumor for a total of three doses over one week, while the distant tumor was left untreated. (B-D) Mice were treated with AIRISE-02 (NP carrying 20 μg CpG and 4 μg siSTAT3 per each injection) and controls. CpG-NP and siSTAT3-NP contain the same amount of CpG and siSTAT3, respectively, as AIRISE-02. Tumor growth curves of B) local treated tumors and C) distant untreated tumors are plotted as mean ± SEM for mice that survived the first 9-15 days (i.e., >75% of all mice per group, each group still has the same average starting tumor size). Spider plots of tumor sizes for all mice without exclusion were reported in Figure S7 in the Supporting Information. D) Survival curve of all mice is reported. E-G) In another set of mice treated in a similar manner as (A), mice (n = 3-4) were sacrificed at day 7. Cells harvested from tumors and associated draining lymph nodes (DLNs) were analyzed to determine the ratio of CD8+ T cells over Treg (CD4+FoxP3+) within the T cell (CD45+CD3+) population of E) local and distant tumors and F) their associated tumor-DLNs, and G) proliferation status (Ki67) of effector T cells (CD44+CD8+) in tumor-DLNs. To confirm immune-mediated therapeutic action, mice were treated with AIRISE-02 (as shown in (A)) with or without CD8 depletion (200 μg anti-CD8 Ab; i.p. twice weekly throughout the entire study), and monitored for the growth of H) local (AIRISE-02-treated) and I) distant (untreated) tumors, along with J) their survival profile. Statistical significance (*p<0.05, **p<0.01, ***p<0.001, ****p<0.0001) is between the test group and saline group, unless specified otherwise by brackets. $p<0.05, $$$$p<0.0001 in (B) and (C) denote the statistical significance of AIRISE-02 vs. CpG-NP. Statistical significance of AIRISE-02 versus saline is not shown in (B) and (C), but shown in (H) and (I) for local and distant tumors, respectively. Saline and AIRISE-02 treatments were conducted independently twice (along with other groups in this figure and Figure 3), and the combined data were used for both figures.