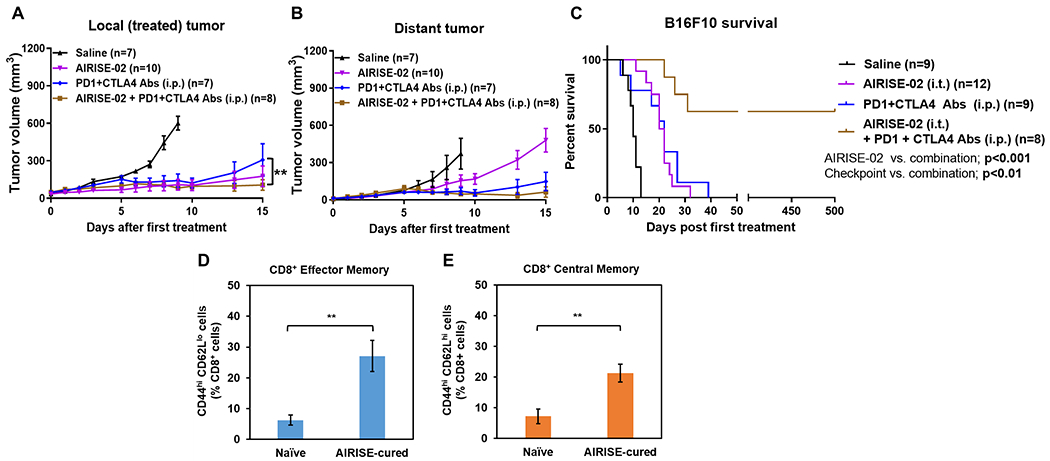
Figure 3. AIRISE-02 + immune checkpoint inhibitors (ICIs) cured mice bearing B16F10 bilateral tumors.

Mice were treated with AIRISE-02 alone (same model and AIRISE-02 treatment as in Figure 2), ICIs alone (200 μg PD-1 Ab + 100 μg CTLA-4 Ab/mouse; i.p. given three times total on the same days as AIRISE-02) or AIRISE-02 + ICIs (given on the same day). A,B) Tumor growth curves of local tumors (A) and distant (untreated with AIRISE-02) tumors (B) are plotted as mean ± SEM for mice that survived the first 9-15 days (i.e., >75% of all mice per group, each group still has the same average starting tumor size). Spider plots of tumor sizes for all mice without exclusion were reported in Figure S7 in the Supporting Information. C) Survival curve of all mice. D,E) At 17 months, blood was collected to investigate the number of circulating effector memory (CD44hi CD62Llo) (D) and central memory (CD44hi CD62Lhi) (E) T cells as percentage of CD8+ T (CD3+CD45+) cells. **p<0.01. Saline and AIRISE-02 treatments were conducted independently twice (along with other groups in Figures 2 and in this figure), and the combined data were used for both figures.
