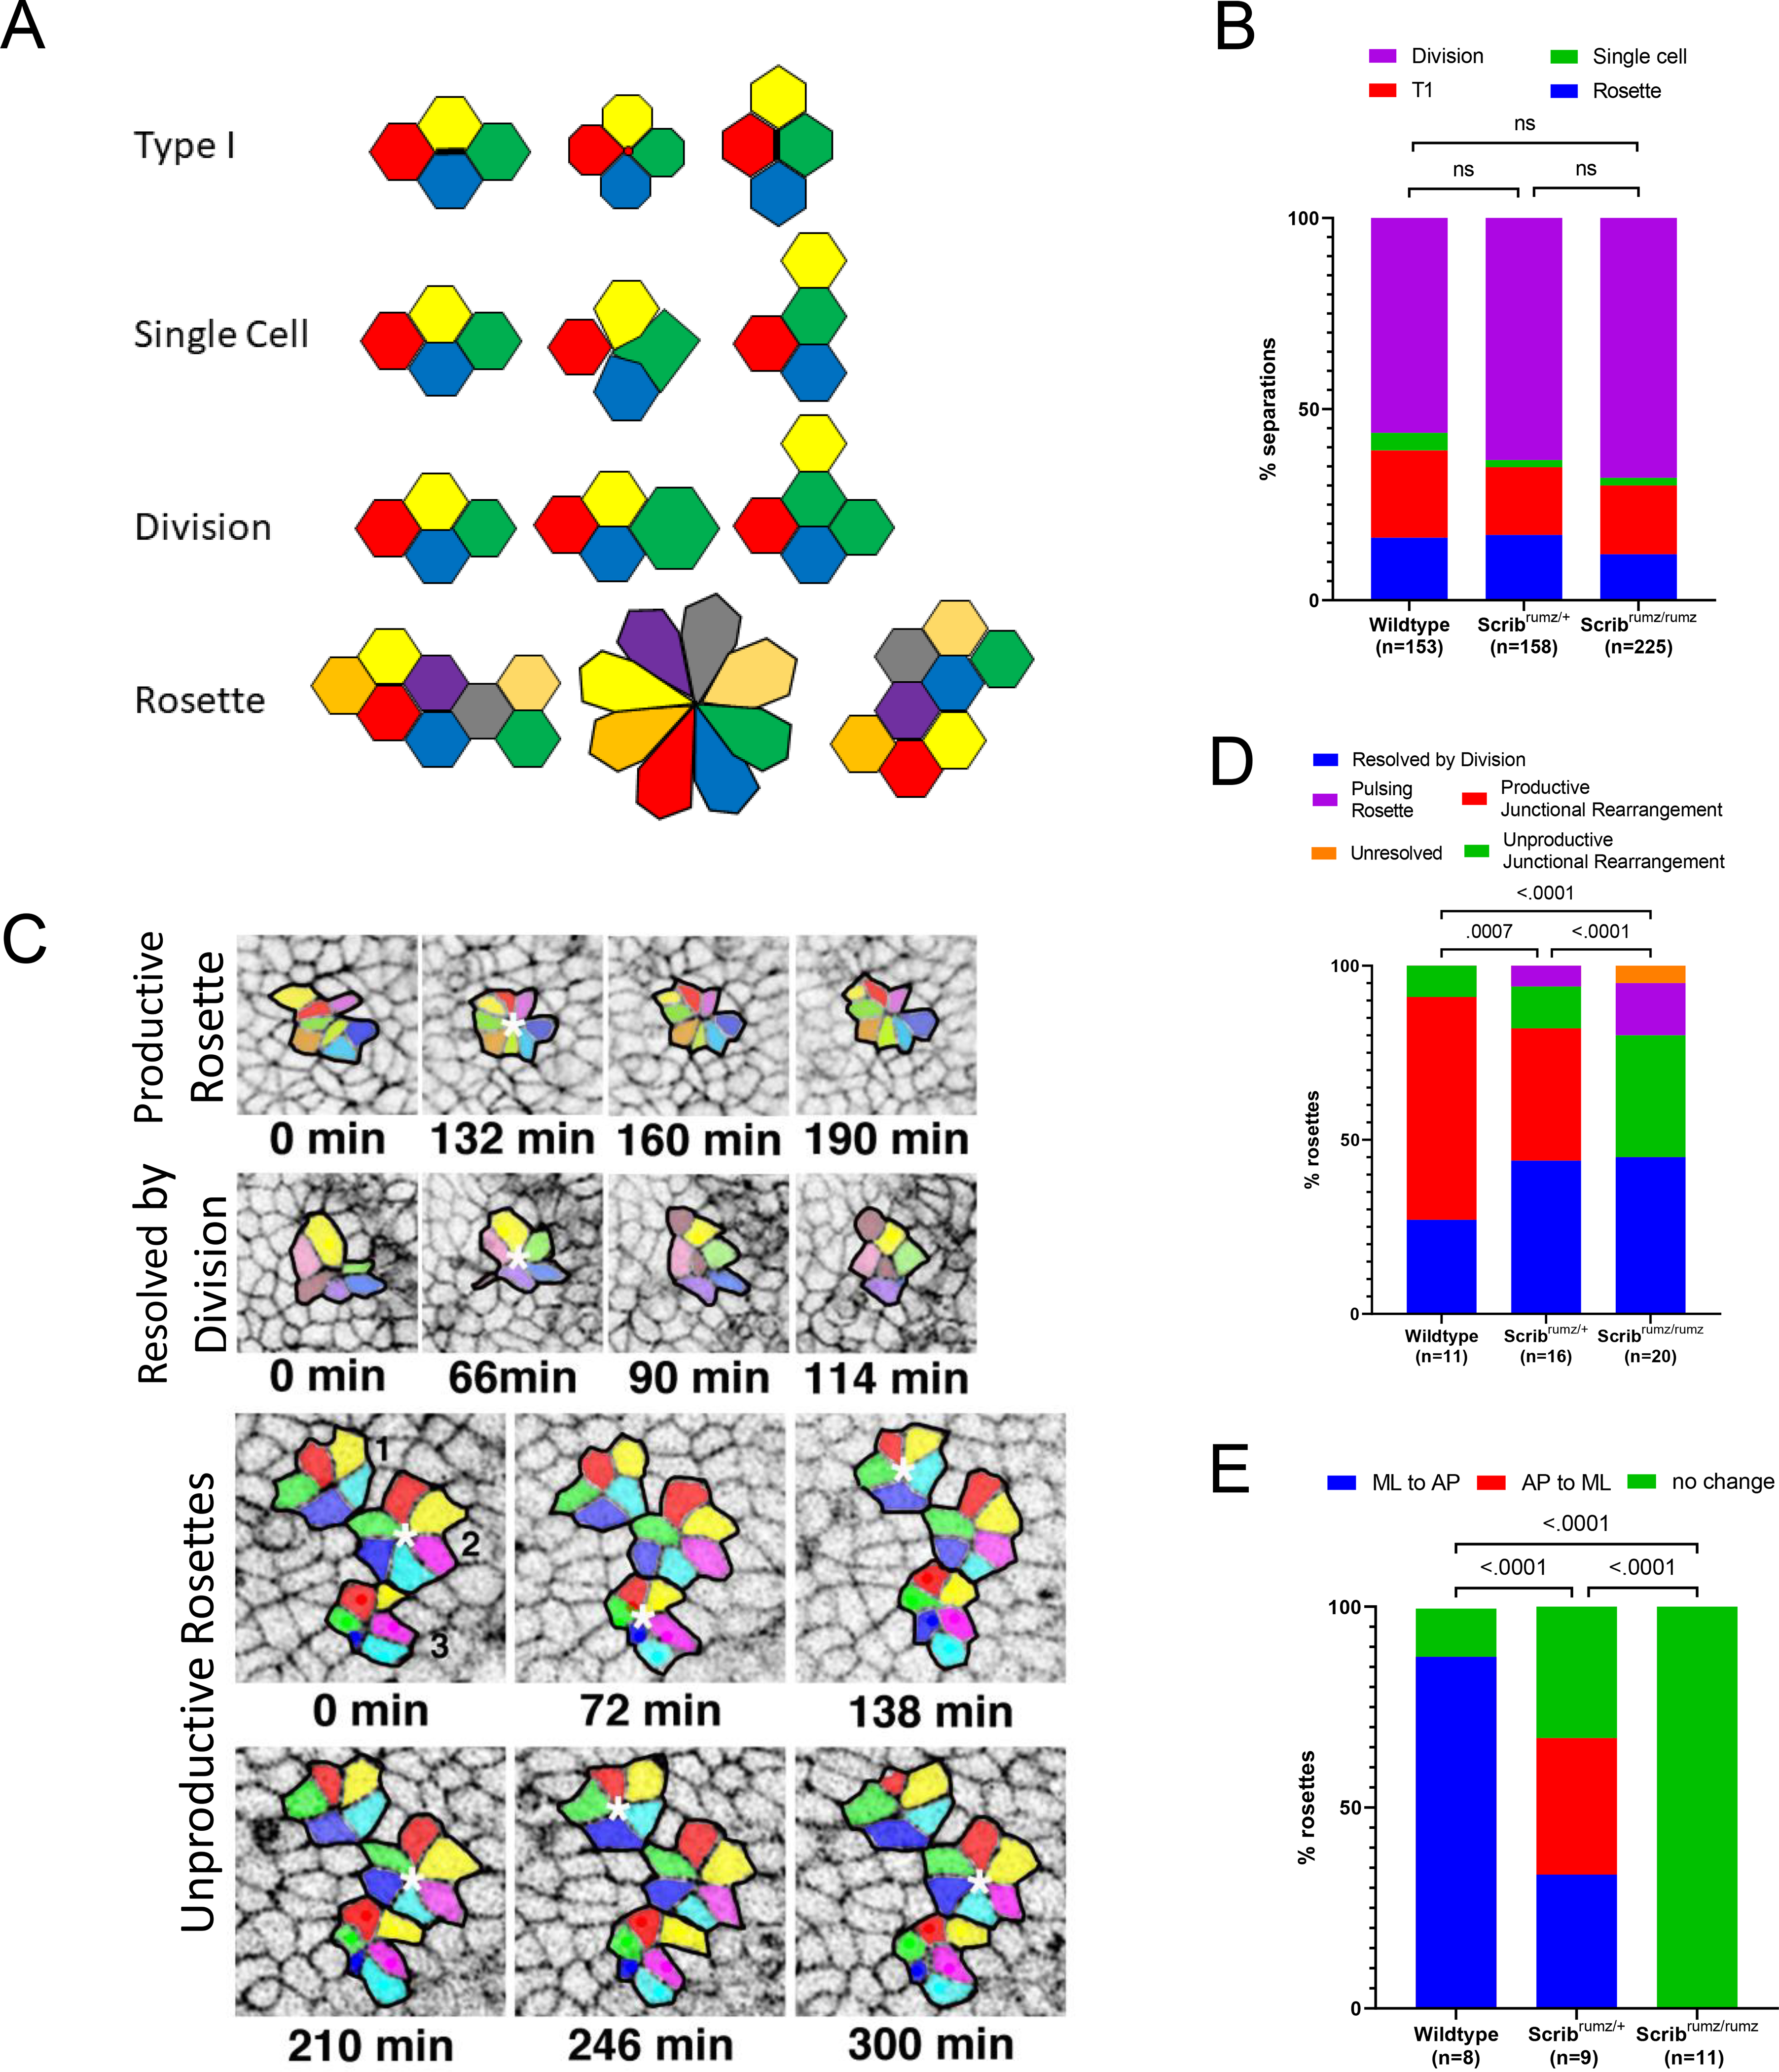
Figure 4. Scribrumz mutation affects rosette resolution.

A) Schematic summary of each type of cell separation mechanism. B) Defects in cell rearrangement mechanisms in neural tissue were assessed by analyzing the percentage of cell intercalations arising from cell division, single cell intercalation, T1 process, and rosette resolution. ns denotes not significant (p>0.05) and was determined by Fisher’s Exact test. n represents the number of intercalations analyzed. C) Representative images of types of rosette resolution. In the panels representing unproductive rosettes, rosette 1 and 2 represent pulsing rosettes, and rosette number 3 shows an unproductive junctional rearrangement resolution. Rosettes are marked with white * and each rosette cluster is outlined in black. D) Graph represents the mechanisms of rosette resolution. p values were determined by Fisher’s Exact test (significance p<0.05) and n represents the number of rosettes analyzed. E) Graph representing the changes in cell cluster orientation during rosette resolution. p values were determined by Fisher’s Exact test (significance p<0.05) and n represents the number of rosettes analyzed that resolved by a mechanism other than division (pulsing, productive junctional rearrangement, unresolved, and unproductive junctional rearrangement).
