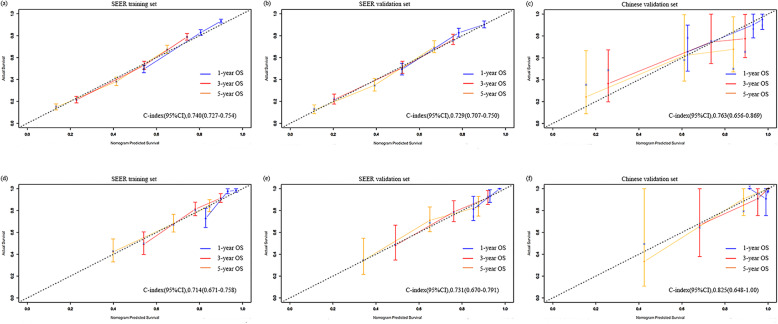
Fig. 3.
Calibration plots comparing the similarity between the nomogram-predicted survival rates (represented by x-axis) and the actual survival rates (represented by y-axis). a 1-, 3-, and 5-year OS for high-grade cancers in the training dataset from the SEER database; b 1-, 3-, and 5-year OS for high-grade cancers in the validation dataset from the SEER database; c 1-, 3-, and 5-year OS for high-grade cancers in the validation dataset from the China multicenter dataset; d 1-, 3-, and 5-year OS for low-grade cancers in the training dataset from the SEER database; e 1-, 3-, and 5-year OS for high-grade cancers in the validation dataset from the SEER database. f 1-, 3-, 5-year OS for low-grade cancers in the validation dataset from the China multicenter database. OS: overall survival; SEER: the Surveillance Epidemiology, and End Results database

