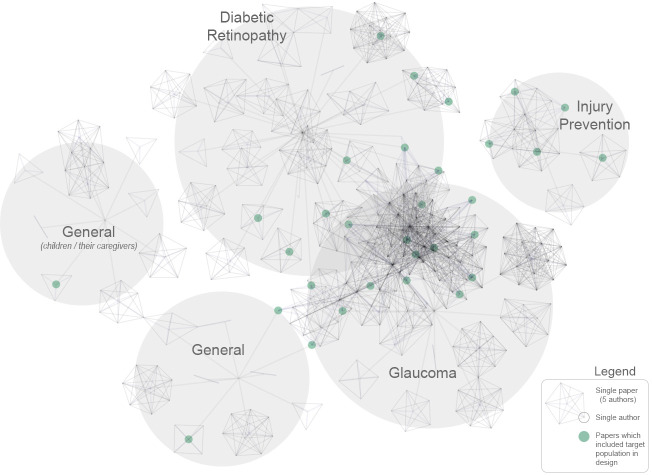
Figure 4.
Summary of included publications by relationship between authors and conditions. Each node represents an author, and each cluster of nodes represents a paper, or groups of papers by similar authors. Papers which included the target population in the design are highlighted in green. Note the clustering of green dots within collaborative networks (although with notable exceptions).

