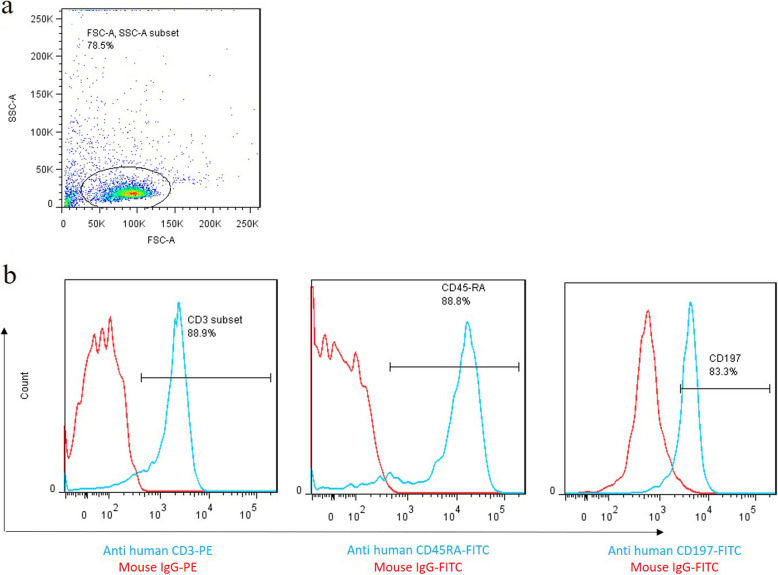
Fig. 1.
Characterization of cord blood naive T cells. Immunophenotypes of the T-cells were examined by flow cytometry. a Graph represented the cell population by using FSC-A versus SSC-A plot. b Overlaid histograms of CD3, CD45RA as well as CD197 expression. T cells were stained using surface staining protocol with specific fluorescent-conjugated antibodies, and the positive population was confirmedusing relevant isotype controls. Red histograms represent the isotype controls, and the blue histograms indicate CD3, CD45RA, and CD197-specific antibodies

