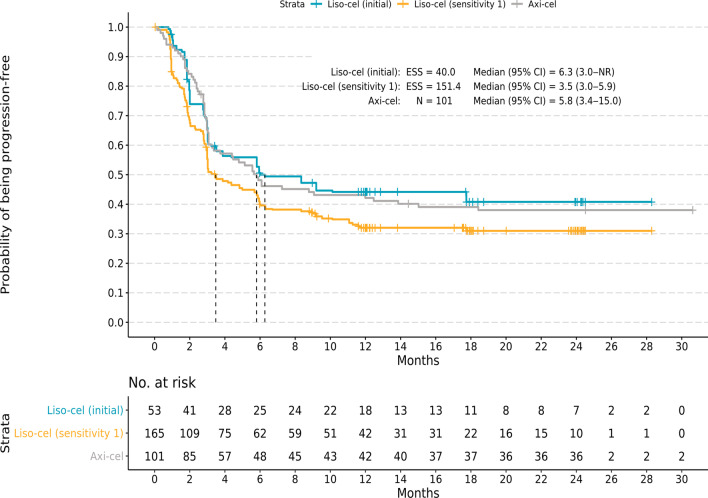
Fig. 1.
Kaplan–Meier curves for progression-free survival. Kaplan–Meier curves are shown for the initial and sensitivity analysis comparisons with liso-cel versus axi-cel for infused patients. Kaplan–Meier curves for the initial analysis, which matched and adjusted for 10 factors, including bridging therapy use, demonstrated similar cumulative probabilities of progression-free survival for liso-cel and axi-cel. Similar results were observed for sensitivity analysis 1, which was the same as the initial analysis except that bridging therapy use was removed as a matching factor. Axi-cel, axicabtagene ciloleucel; CI, confidence interval; ESS, effective sample size; liso-cel, lisocabtagene maraleucel; N, sample size; NR, not reached

