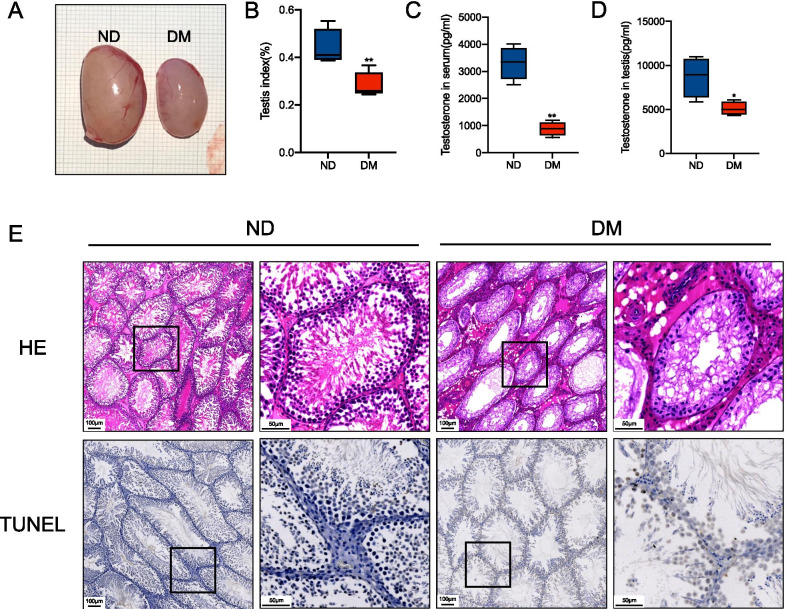
Fig. 1.
Effects of diabetes on testicular function and apoptosis. Eight weeks after diabetes was established, the right testis of each rat was removed and separately photographed (A) and the testis index {(testis weight/body weight) × 100%} was calculated (B). Concentrations of serum (C) and testicular (D) testosterone detected by ELISA in each group. Representative hematoxylin & eosin (H&E) and TUNEL staining of rat testicular tissues from ND (first 2 panels) and DM (last 2 panels) groups. For a better comparison, the second panel in each group is a partially enlarged panel (black box) of the first panel. Scale bar = 100 μm (first panel) and 40 μm (second panel) (E). Data are presented as mean ± SD.*p < 0.05 **p < 0.01 compared with the ND group

