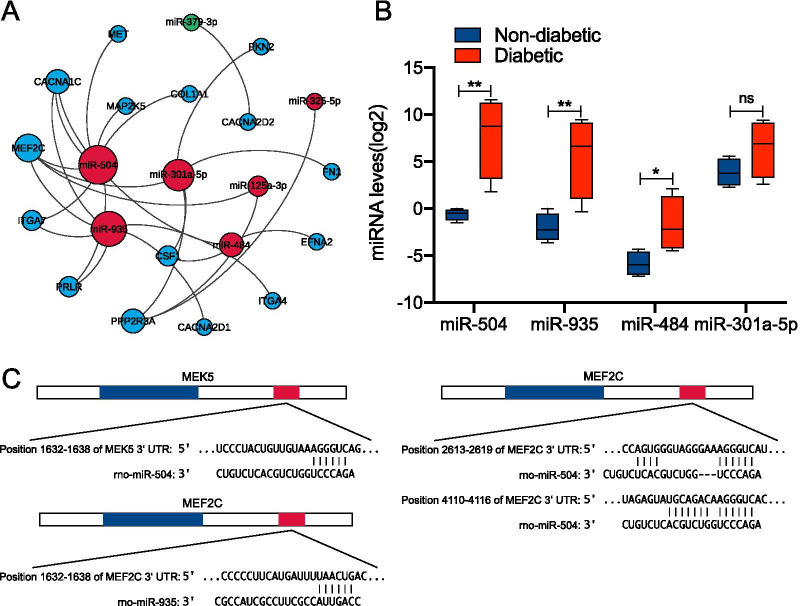
Fig. 3.
RT-qPCR analysis of differentially-expressed miRNAs. The miRNA–mRNA regulation network associated with the PI3K/AKT and MAPK pathways were constructed using the Gephi software (A). RT-qPCR analysis of differentially-expressed miRNAs (miR-504, miR-935, miR-484, miR-301-5p) in the serum of normal glucose tolerance subjects and type 2 diabetic patients (B). Data are presented as box plots, where all fold changes were calculated between medians. The y-axis indicates the expression level of miRNAs on a log2 scale. *p < 0.05, **p < 0.01, NS, not significant. The binding sites of miR-504 and miR-935 in the 3'-UTR of MEK5 and MEF2C mRNA were predicted using miRNA target prediction algorithms

