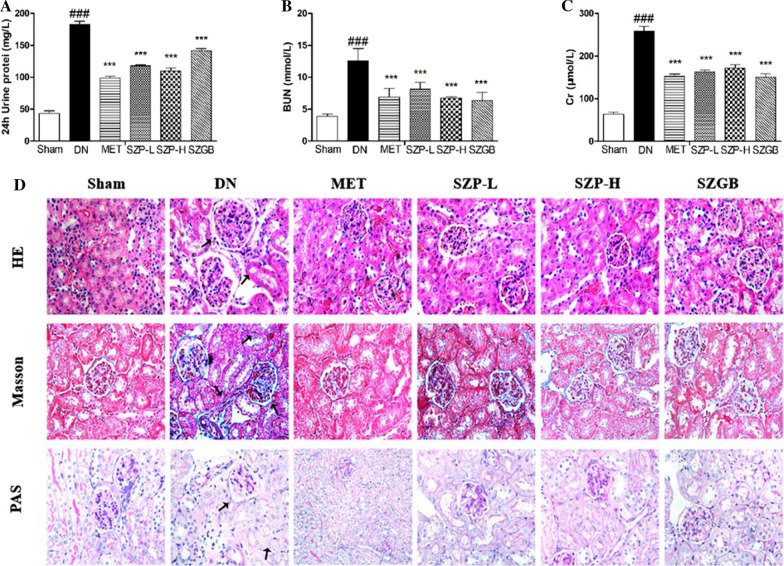
Fig. 3.
The effects of SZP on the parameters of renal function and kidney tissue in DN mice. The expression level of 24-h urinary protein (a). The expression level of serum BUN (b). The expression level of Cr (c). The Photomicrographs (HE, magnification × 400; PAS, magnification × 400; Masson's trichrome-stained, magnification × 400) of different groups (d). Black arrows indicated glomerular hypertrophy, mesangial expansion,tubular dilatation and collagen fiber deposition.The values presented are the means ± SD of six independent experiments (n = 6) and differences between mean values were assessed by ANOVA. ###P < 0.01 versus sham control group, ***P < 0.01 versus DN group. Cr, serum creatinine. HE, hematoxylin and eosin; PAS, periodic acid-Schiff

