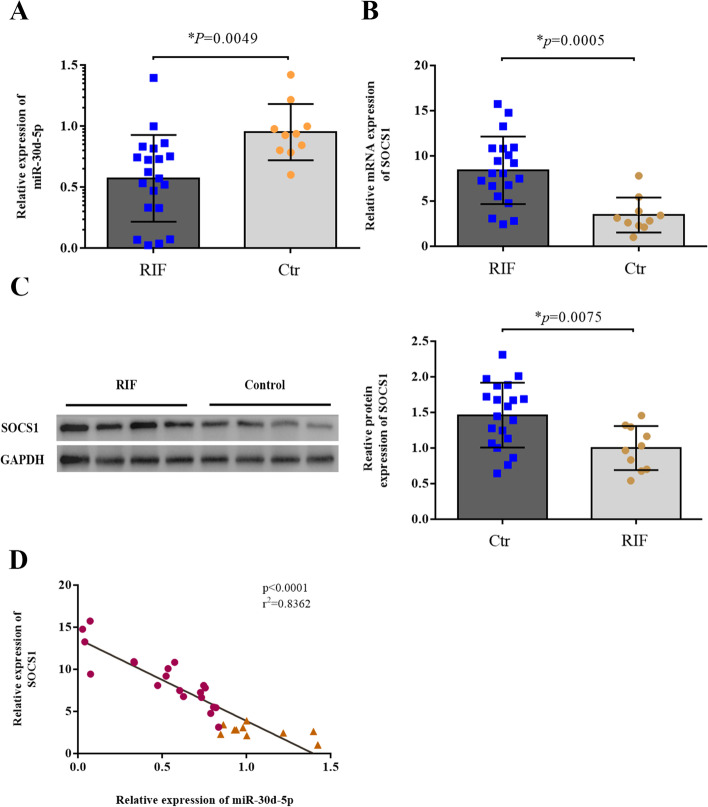
Fig. 3.
Comparison of miR-30d-5p and SOCS1 expression in endometrium samples from the RIF and control groups. A, B The relative expression levels of miR-30d-5p and SOCS1 in the RIF group (n = 20) and the control group (n = 10), as detected via RT-qPCR; U6 was used as an internal control for miR-30d-5p; GAPDH was used as an internal control for SOCS1. C The relative expression level of SOCS1 protein in the RIF group (n = 20) and the control group (n = 10), as detected via western blotting; GAPDH was used as internal control. D Spearman correlation suggests a significant negative correlation between the expressions of miR-30d-5p and SOCS1. The Spearman correlation coefficient, P values, and sample numbers are indicated on the upper right of the plot. *P < 0.05

