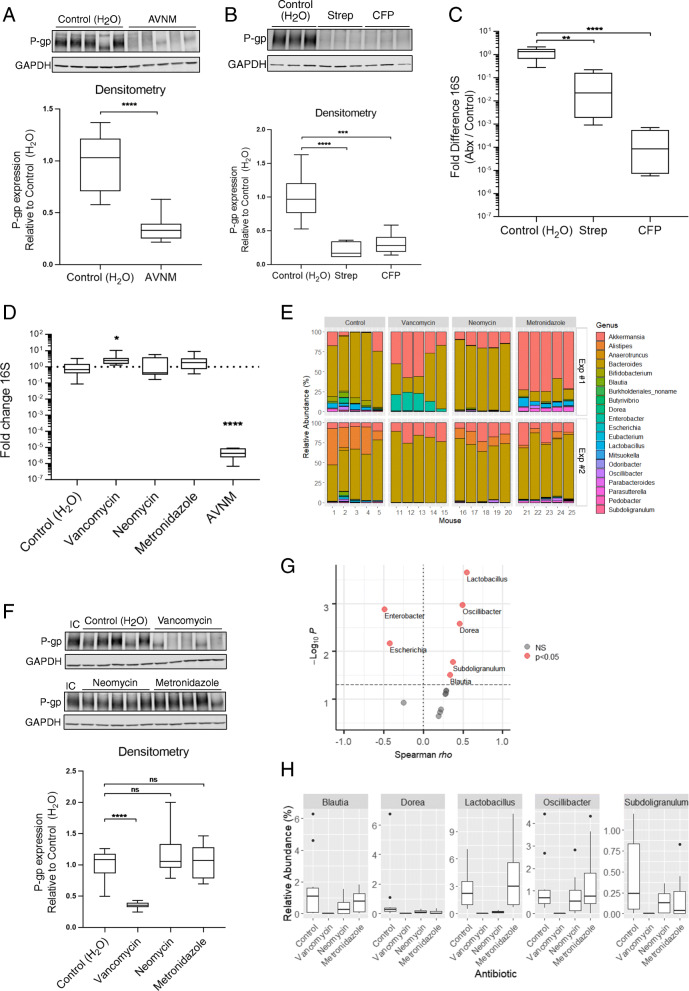
Fig. 1.
Vancomycin-sensitive gut microbiota is required for colonic P-gp expression. A, D WT SPF mice were treated with AVNM for 10 days. Representative western blot of P-gp protein expression in colonic tissue is shown, each lane representing a replicate mouse within each group. N = 10 mice per group; ****p < 0.0001, unpaired t test. B, C WT SPF mice were treated with streptomycin (Strep) or cefoperazone (CFP) for 7 days. B P-gp protein expression was measured as in A. Representative western blot is shown, each lane representing a replicate mouse within each group. N = 6 mice per group; ***p = 0.0003, ****p < 0.0001, one-way ANOVA with Dunnett’s multiple comparisons test. C Fold difference changes in relative amount of 16S DNA in feces collected from mice on the last day of antibiotic treatment are shown. Data are pooled from two independent experiments, N = 6 per group ****p < 0.0001, **p = 0.0028 one-way ANOVA with Dunnett’s multiple comparisons test, statistical test for both based on ΔΔCt values. D Fold difference in relative amount of 16S DNA in feces collected from mice on day 10 of antibiotic delivery (A, E–H), relative to control. Data are pooled from two independent experiments, N = 10 mice per group. *p = 0.0178, ****p < 0.0001, one-way ANOVA with Dunnett’s multiple comparisons test, based on ΔΔ Ct values. D–H WT SPF mice were treated with vancomycin, neomycin, metronidazole, or AVNM for 10 days. E Relative abundance of bacterial genera in mouse fecal microbiota. Representative plot from each of two independent experiments is shown. N = 5 per group, per experiment. F P-gp protein expression was measured as in (A, B). An internal control (“IC”) lysate was included across multiple blots for normalization. Representative western blot is shown, each lane representing a replicate mouse within each group. N = 10 mice per group; ****p < 0.0001, ns p > 0.05, one-way ANOVA with Dunnett’s multiple comparisons test. A, B, F Densitometry data describe samples pooled from two independent experiments. G Bacterial genera positively or negatively correlated with colonic P-gp expression by Spearman correlation test of sequencing data from experiments performed in Fig. 1, significance indicated by p < 0.05. H Relative abundance of bacterial genera positively correlated with colonic P-gp expression shown in G

