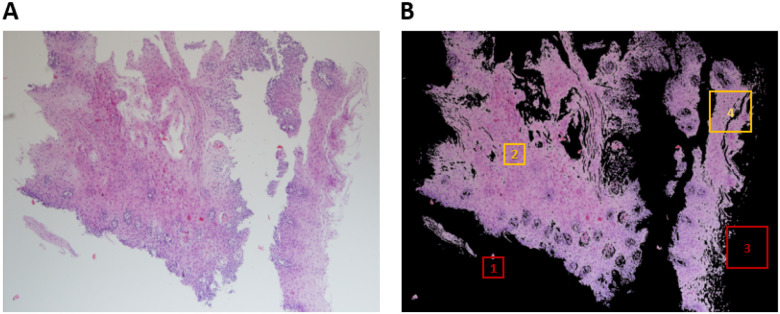
FIGURE 2.
Steps in processing esophageal biopsy images to produce patches. (A) A typical image of a hematoxylin and eosin (H&E) stained esophageal biopsy section obtained from an individual with active EoE. The image was taken at  magnification. (B) The same image after background removal with an illustration of tissue coverage criteria per patch size to meet the threshold for inclusion in training or validation sets. Box 1 (red): patch of 224 × 224 pixels with less than 10% tissue coverage. Box 2 (yellow): patch of 224 × 224 pixels with greater than 10% tissue coverage. Box 3 (red): patch of 448 × 448 pixels with less than 10% tissue coverage. Box 4 (yellow): patch of 448 × 448 pixels with greater than 10% tissue coverage.

