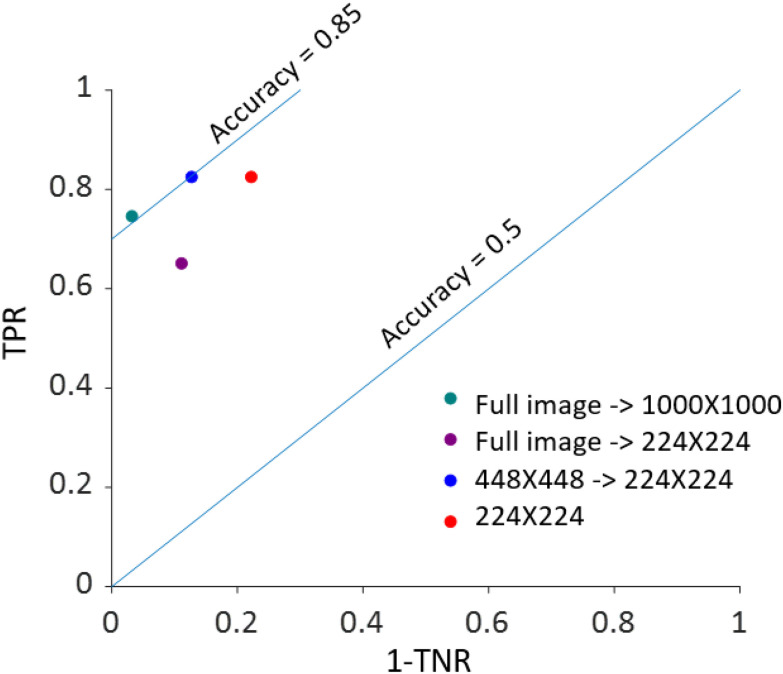
FIGURE 3.
Classification results as a function of initial image size and downscaling factor in the receiver operating characteristic (ROC) space. For each of the four downscale and/or crop approaches utilized to analyze the validation cohort of images (n = 63 active EoE; n = 63 non-EoE), the true positive rate (TPR) vs. (1 - the true negative rate [TNR]) with TPR and TNR expressed as proportions is graphed. Blue lines highlight accuracy measurements of 50% and 85% expressed as proportions.

