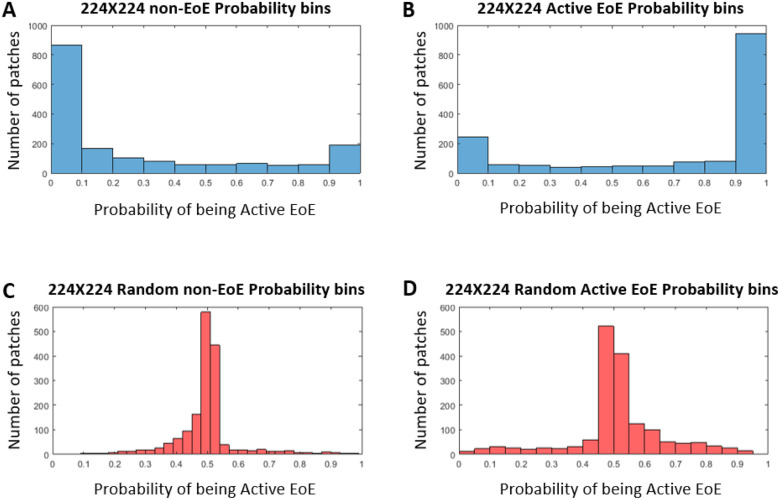
FIGURE 4.
Prediction ability of nonrandom (blue) and random (red) classifier. (A) 224 × 224: histogram of the number of patches derived from non-EoE images vs. the probability that they will be classified as active EoE by the nonrandom classifier. (B) 224 × 224: histogram of the number of patches derived from active EoE images vs. the probability that they will be classified as active EoE by the nonrandom classifier. (C) Random 224 × 224: histogram of the number of patches derived from non-EoE-labeled images vs. the probability that they will be classified as active EoE by the random classifier. (D) Random 224 × 224: histogram of the number of patches derived from active EoE-labeled images vs. the probability that they will be classified as active EoE by the random classifier.

