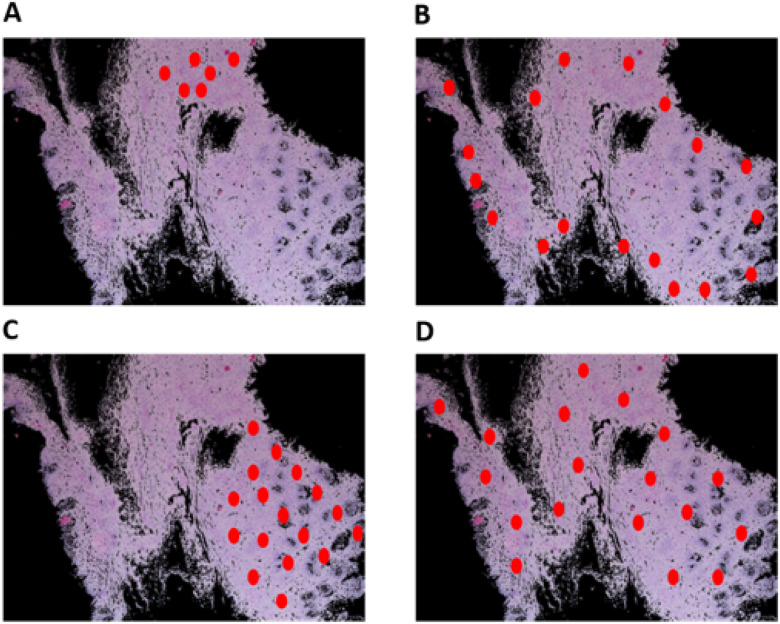
FIGURE 5.
Schematic of various potential distributions of local patterns within an esophageal biopsy section. An esophageal biopsy image is shown; red ovals denote a local feature that contributes to disease diagnosis. (A) Local pattern confined to a specific place in the tissue. (B) Local pattern distributed at the edge of the tissue. (C) Local pattern restricted to only half of the tissue. (D) Global pattern spread all over the tissue.

