
Figure 3.
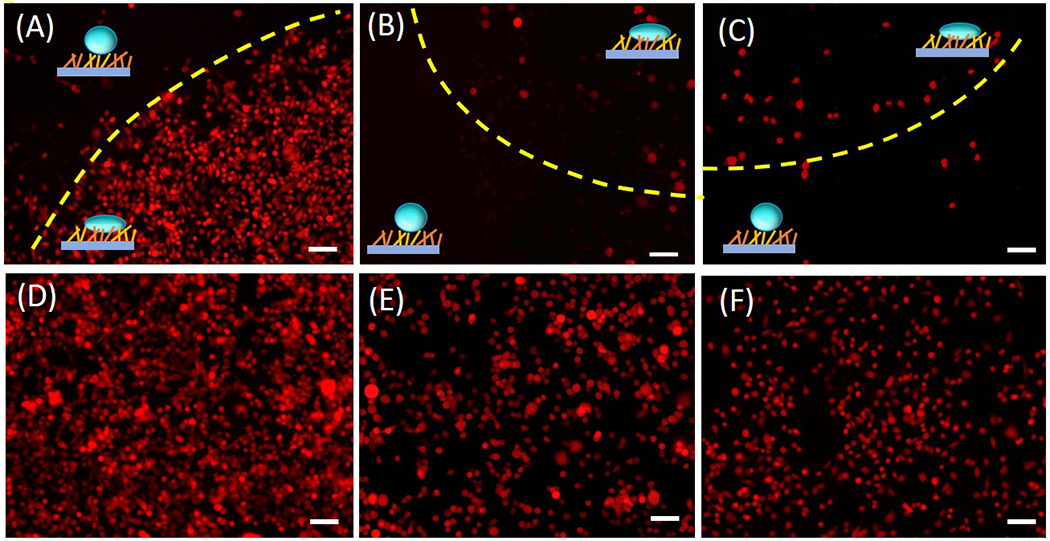
(A)-(C) Fluorescence image of P231, LM231 and BoM cells on hydrophobic-hydrophilic Au/SiNWs observed after 2 days of plating on the substrate. The yellow dashed line demarcates the hydrophilic and the hydrophobic region, which are also marked with schematic representations. (D)-(F) Fluorescence image of the P231, LM231 and BoM cells on a flat surface used as a control. Scale Bar 100 μm.