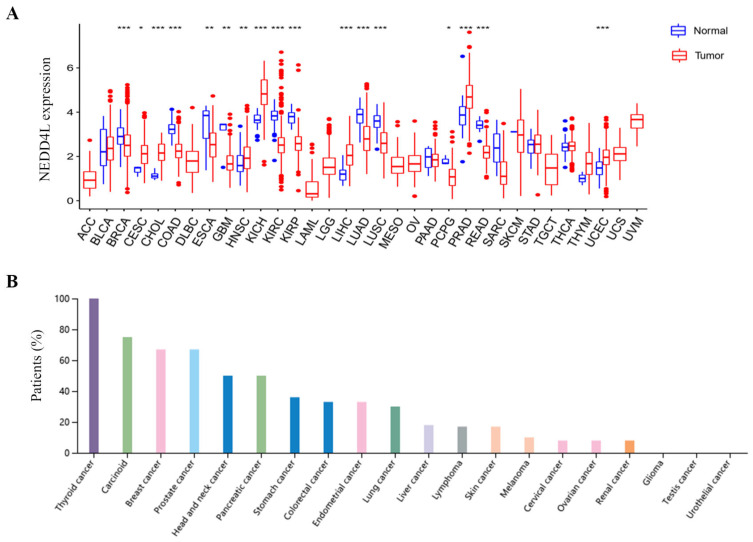
Figure 1.
Analysis of NEDD4L expression. (A) Box plots of NEDD4L mRNA levels in neoplastic tissues. Blue represents non-tumor tissues and red represents tumor tissues. * p-value < 0.05, ** p-value < 0.01, ***p-value < 0.001. (B) Bar charts of NEDD4L expression analysis (immunohistochemical staining) in various cancers. The results were download from The Human Protein Atlas.

