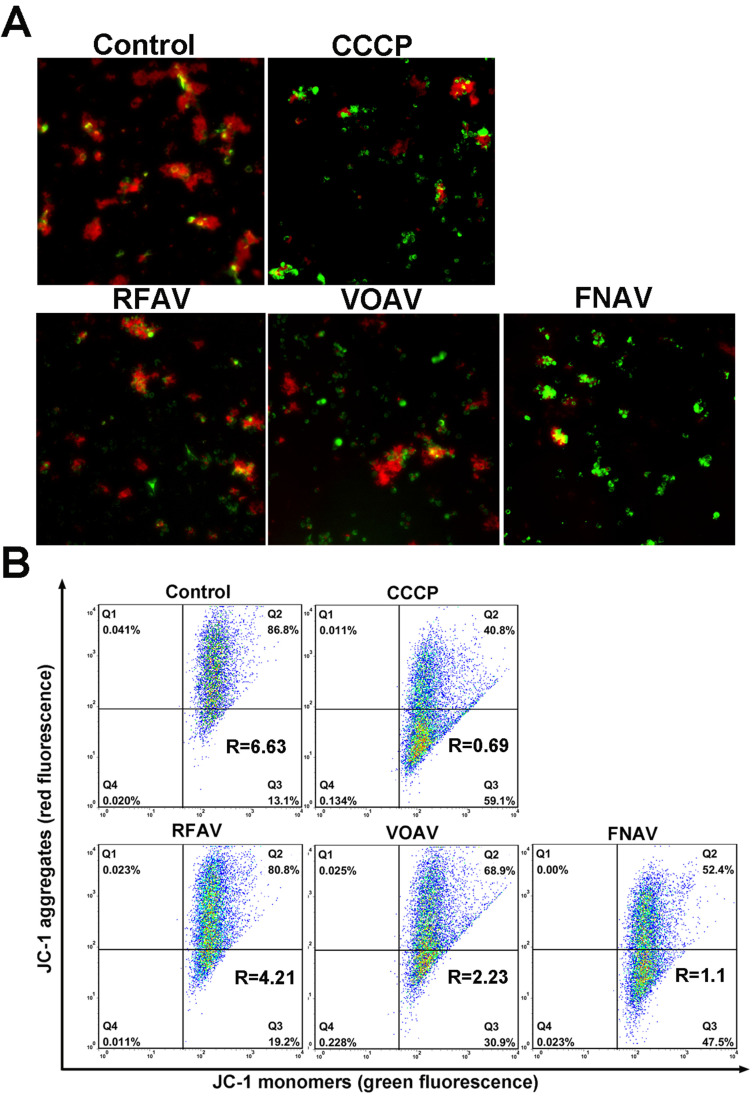
Figure 4.
The change in the mitochondrial membrane potential after MFC cells were treated with CCCP (positive control), VOAV, FNAV or RFAV at 50 µg/mL for 24 h. (A) MFC cells were detected under a fluorescent microscope. (B) The ratio of red/green fluorescence intensity was determined by flow cytometry.

