Figure 1.
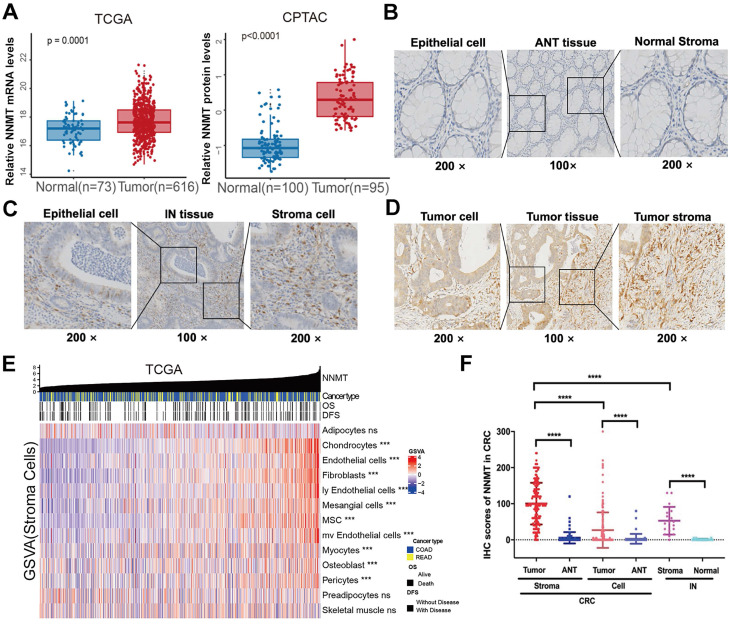
NNMT is overexpressed in CRC from public datasets and clinical sample IHC result of our study cohort. (A) Box plots showed higher NNMT expression in tumor tissue compared to ANT in CRC from TCGA and CPTAC datasets. (B). The almost no or extremely low NNMT staining in ANT tissue was observed at low (×100) and high (×200) magnification, respectively. (C) The moderate NNMT staining in IN tissue was observed at low (×100) and high (×200) magnification, respectively. (D) The high NNMT staining in tumor tissue was observed at low (×100) and high (×200) magnification, respectively. (E) The relationship of NNMT expression with stroma component in CRC tissue (TCGA). (F) The quantified results of NNMT expression by IHC in colorectal cancer. (*p<0.05, **p<0.01, ***p<0.001, NS=no signification)

