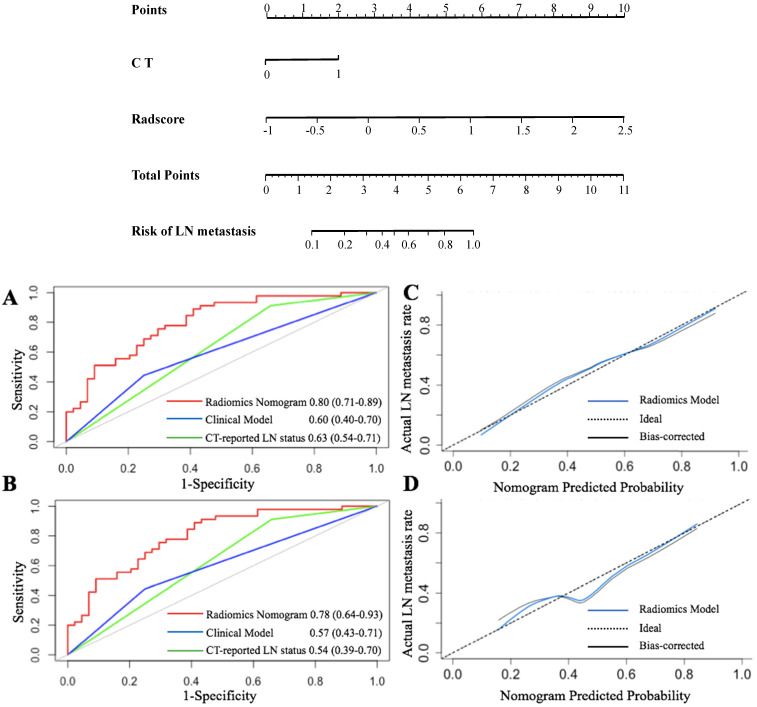
Figure 4.
Radiomics nomogram for predicting LN status accompanied by ROC and calibration curves. A radiomics nomogram was established based on the primary cohort, with the incorporation of radiomics features and CT only. (A and B) represent the ROC curves among the radiomics, clinical, and CT score for predicting LN status in two cohorts, respectively. Calibration curves of the radiomics nomogram in the primary (C) and validation (D) cohorts.

