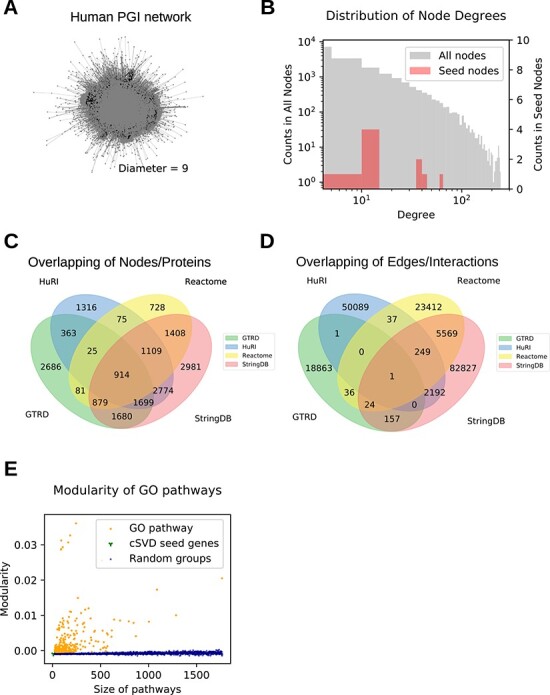
Figure 2.

Domain knowledge-guided curation of human protein–gene–disease interaction and assembly of interaction networks. (A) The human PGI network. (B) A heavy tail distribution of degree centrality in PGI network. (C) Venn diagram showing overlaps of genes among databases. (D) Venn diagram showing overlaps of interactions among databases. (E) Modularity of network by GO term ontologies.
