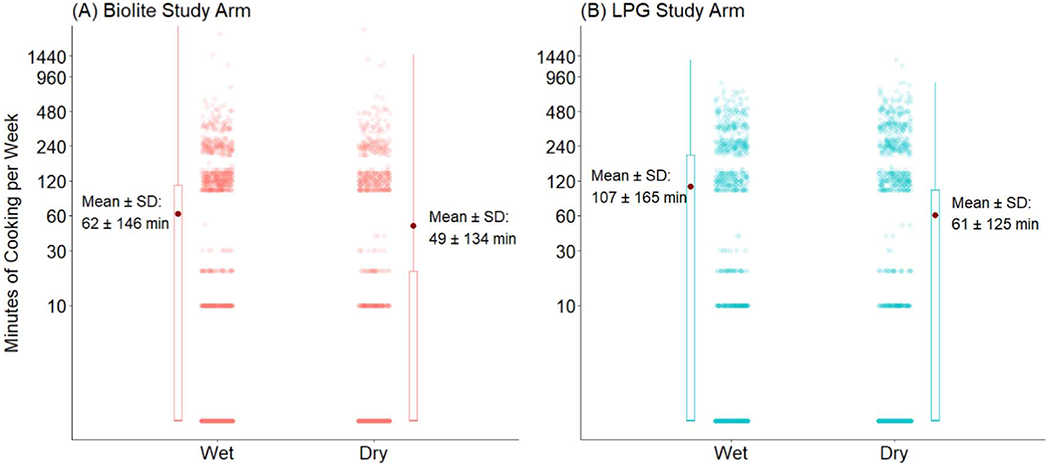
Figure 7.

Minutes of stove use per week in the subcohort by stove and season (y axis is spaced logarithmically). Dark red point = mean, dots = observations of minutes cooking per week. Box = interquartile range (IQR), whiskers = 1.5 times the IQR. Median of each group = 0 min.
