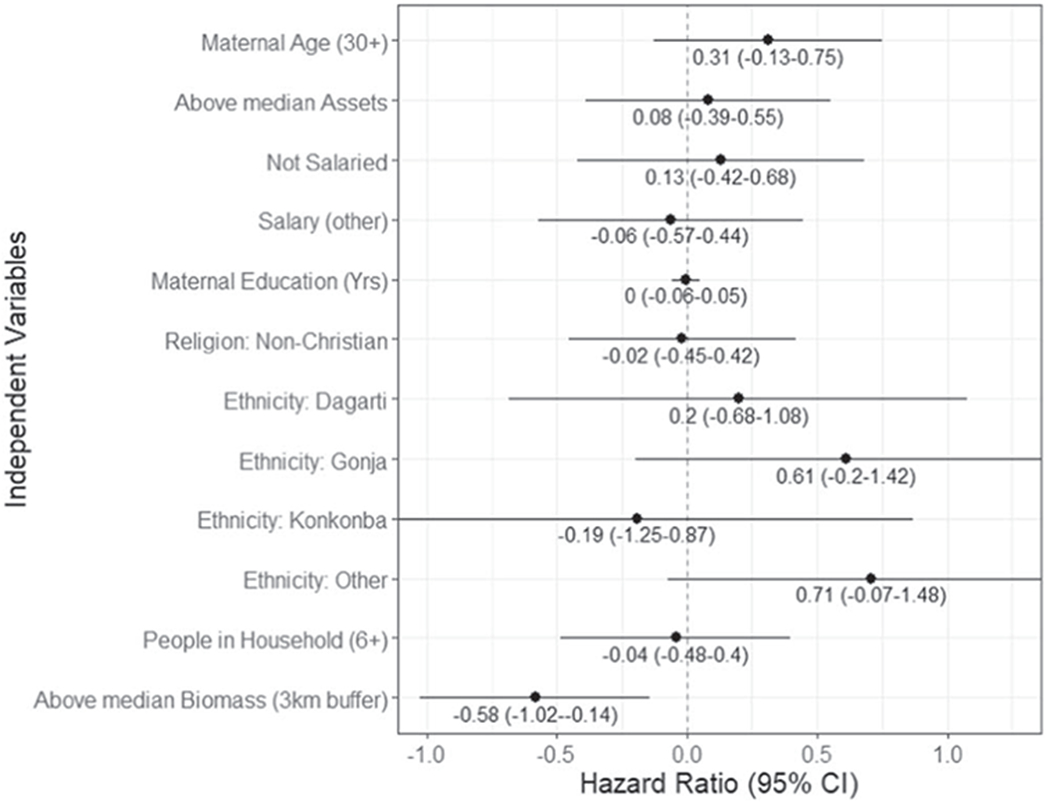
Figure 8.

Univariable Cox proportional hazard regression coefficients: Hazard ratios with 95% confidence intervals. Outcome is stove use discontinuance (week after last measured use). Positive values indicate increased discontinuance by the end of the study period, negative indicate decreased discontinuance. n = 103.
