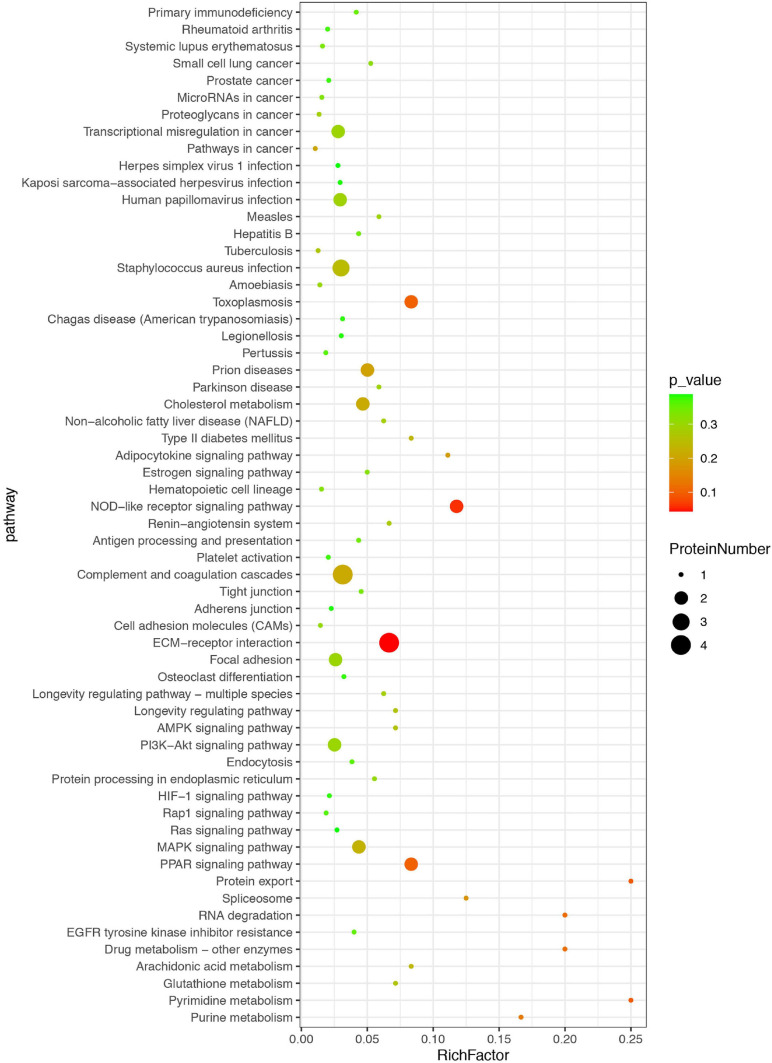
FIGURE 4.
Kyoto Encyclopedia of Genes and Genomes (KEGG) enrichment analysis of differential proteins. The differentially expressed proteins were classified based on KEGG database. Each bubble represents one pathway, and the size of the bubbles reflects the protein number in each pathway. Bubble color represents the p-value of enrichment.

