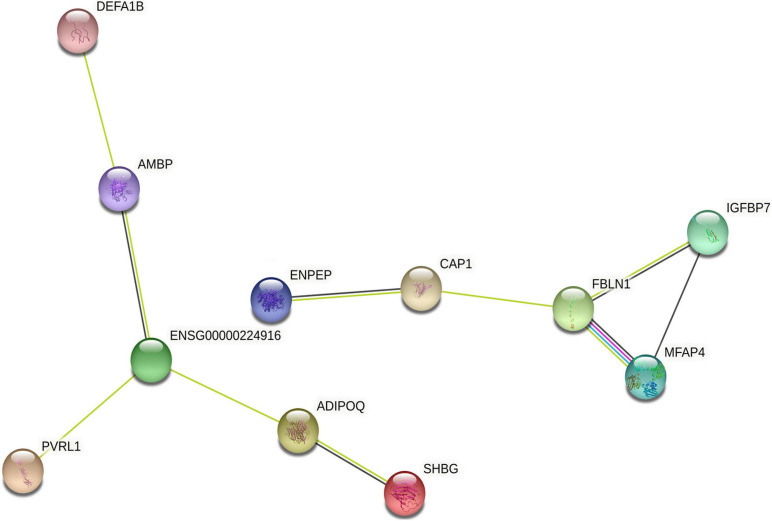
FIGURE 5.
The interaction network of differentially expressed proteins. The interaction network of differentially expressed proteins was analyzed using String database. Each node represents one differential protein, and each connection reflects the interaction of proteins. The color of lines between proteins indicates the source of connection scores: co-expression (dark), experimentally determined interaction (blue), atabase annotated (pink), and automated text mining (green). The full names of the proteins are shown in Table 5.

