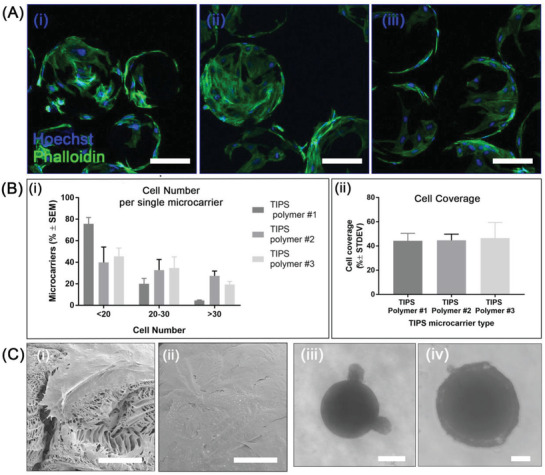
Figure 2.

Cell adhesion of AdMSC on TIPS microcarriers. A) Confocal microscopy images of phalloidin (green) and Hoechst (blue) stained AdMSC attached to the surface of TIPS microcarriers composed of polymer 1 i), polymer 2 ii), and polymer 3 iii) microcarriers after 6 h incubation. Scale bar: 100 µm. B) Quantitative evaluation of cell adhesion on TIPS microcarriers after 6 h. i) relative quantity of TIPS microcarriers with cells attached within a specific range (data from three experiments; n = 70–90 TIPS microcarriers per type and experiment). ii) Surface coverage of microcarriers by cells per single TIPS microcarrier. Coverage is expressed as mean % ± standard deviation (STDEV) (≈120 TIPS microcarriers measured per polymer type). C) SEM images of AdMSC adhered to the surface of a TIPS microcarrier composed of polymer 1 for 24 h i,ii) (scale bar in Ci is 20 µm; scale bar in Cii is 50 µm); iii,iv) brightfield microscopy images of AdMSC attached to a single microcarrier in the hanging drop culture at 48 h postseeding: iii) a solid microcarrier and iv) TIPS microcarrier composed of polymer 3 (scale bar in Ciii and Civ is 100 µm).
