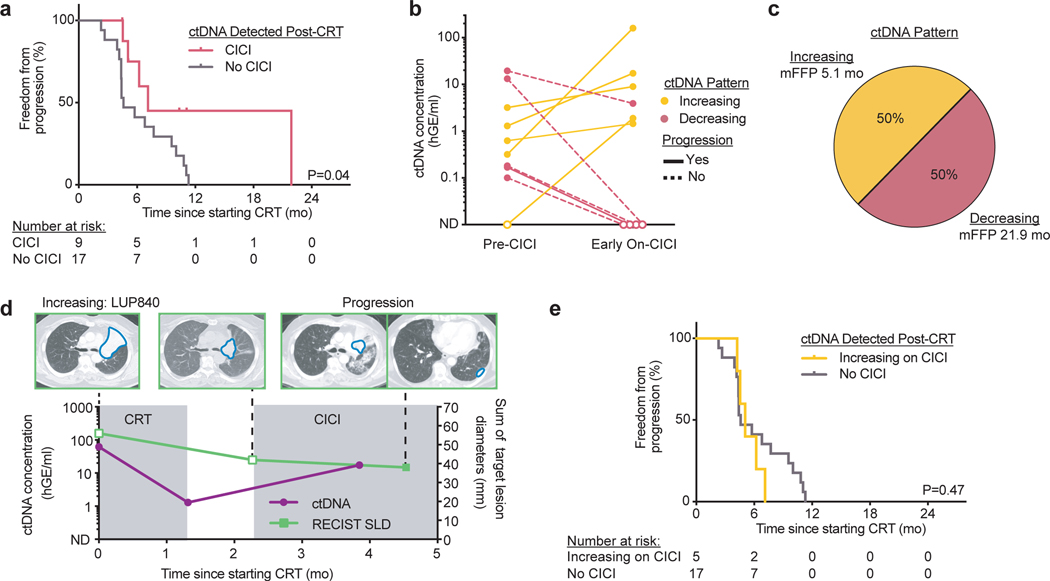
Fig. 4: ctDNA dynamics predict benefit from consolidation immune checkpoint inhibition (CICI) after chemoradiation therapy (CRT).
a, Kaplan-Meier analysis of freedom from progression in patients with ctDNA detected pre-CICI treated with CICI (n=9) and patients with ctDNA detected post-CRT treated without CICI (n=17). P value was calculated using a two-sided log-rank test. b, ctDNA concentrations for the two ctDNA patterns observed in patients from the CICI cohort with ctDNA detected in the pre-CICI or early on-CICI samples. “Increasing”: ctDNA concentration increases early on-CICI. “Decreasing”: ctDNA concentration decreases early on-CICI. Only patients with evaluable pre-CICI and early on-CICI samples are included. Patients with disease progression in the follow-up period are denoted with a solid line, and patients without disease progression are denoted with a dashed line. c, Percentage of patients and median freedom from progression (mFFP) for each ctDNA pattern. d, Example of longitudinal CT imaging and ctDNA concentrations for a patient with the ctDNA “Increasing” pattern. ctDNA was detected pre-CICI and increased during CICI in a patient who developed pleural metastases, suggesting ctDNA can identify a lack of response to CICI. A total of 4 patients in the CICI cohort had similar ctDNA testing and clinical outcomes. e, Kaplan-Meier analysis of freedom from progression in patients with the ctDNA “Increasing” pattern during CICI (n=5) and patients with ctDNA detected post-CRT treated without CICI (n=17). P value was calculated using a two-sided log-rank test.

