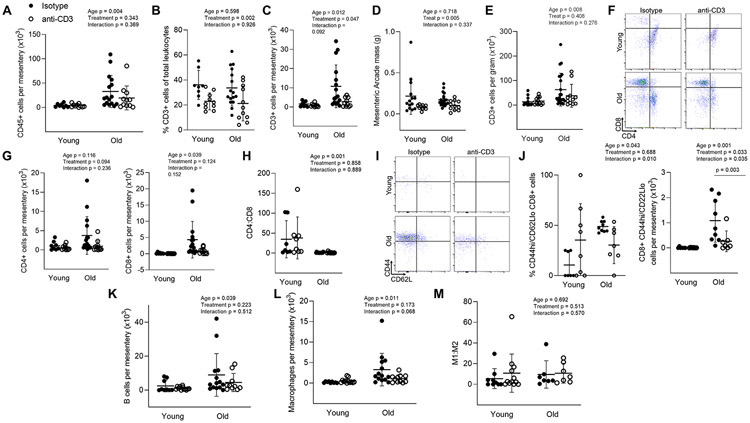
Figure 5: Mesenteric T cell accumulation with age and anti-CD3 F(ab’)2 Fragment treatment.
Single cell suspensions of the mesenteric vascular arcade from young isotype (n = 8-14), young anti-CD3 (n = 10-12), old isotype (n = 9-21) and old anti-CD3 mice (n = 7-11) (excluding lymph nodes) were stained for CD45 (total leukocytes), CD3 (pan T cells), CD4, CD8, CD44 (memory) and CD62L (central vs. effector). (A) Number of total leukocytes per mesentery. (B) Proportion of CD3 cells out of all mesenteric leukocytes. (C) Mesenteric CD3 cell counts. (D) Mesenteric arcade mass. (E) Mesenteric CD3 cell counts normalized to tissue mass. (F) Sample CD4 and CD8 flow cytometry plot. (G) Mesenteric CD4 (left) and CD8 (right) T cell counts. (H) Mesenteric CD4:CD8 ratio. (I) Sample mesenteric naïve (CD44lo) vs memory (CD44hi) flow cytometry plots. (J) Proportion of mesenteric (left) and counts (right) of CD8 CD44hi/CD62Llo effector memory T cell counts. To assess mesenteric macrophage and B cell accumulation, mesenteric single cell suspensions were stained for CD45 (total leukocytes), CD19 (B cells), CD64 (macrophages), CD11c (exclusion of dendritic cells) and CD206 (M1/M2 macrophage phenotype. (K) mesenteric B cell counts. (L) mesenteric macrophage counts. (M) macrophage M1:M2 ratio. Two-way ANOVA was employed to assess the effects of age and anti-CD3 treatment. p values for age, treatment and the age x treatment interaction are inset on each panel. When a significant age x treatment interaction occurred Tukey’s post hoc test was employed to determine group differences. Significant post hoc test p values are included on the panel with a horizontal line indicating the group comparison. Data are shown as mean ± standard deviation, n represents the number of independent animals in each group.

