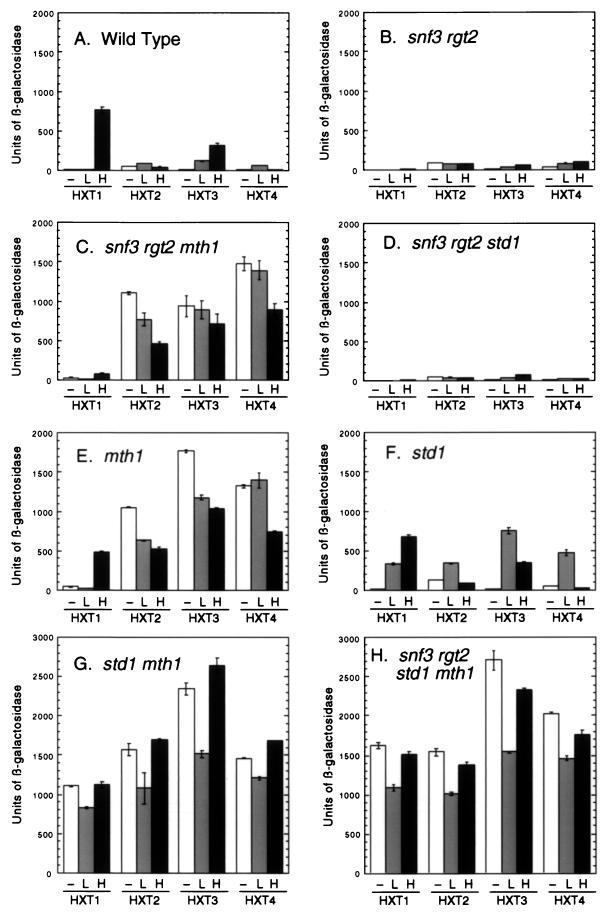
FIG. 5.
HXT gene expression in cells with mutations in SNF3, RGT2, STD1, and MTH1. Cultures were grown in SC medium containing 3% glycerol and 2% ethanol and lacking uracil. Cells were collected and resuspended in the same medium containing either no glucose (−), 0.1% glucose (L), or 6% glucose (H). After 4 h in this medium, cells were harvested and protein extracts were assayed for β-galactosidase activity. Extracts from three independent transformants of each culture were assayed, and the mean value is plotted; the error bars represent 1 standard error. All bar graphs are drawn to the same scale, allowing direct comparisons between the different panels. The strains used were MSY465 (wild type), MSY441 (snf3 rgt2), MSY445 (snf3 rgt2 mth1), MSY443 (snf3 mth1 std1), MSY460 (mth1), MSY467 (std1), MSY471 (std1 mth1), and MSY447 (snf3 rgt2 std1 mth1).

