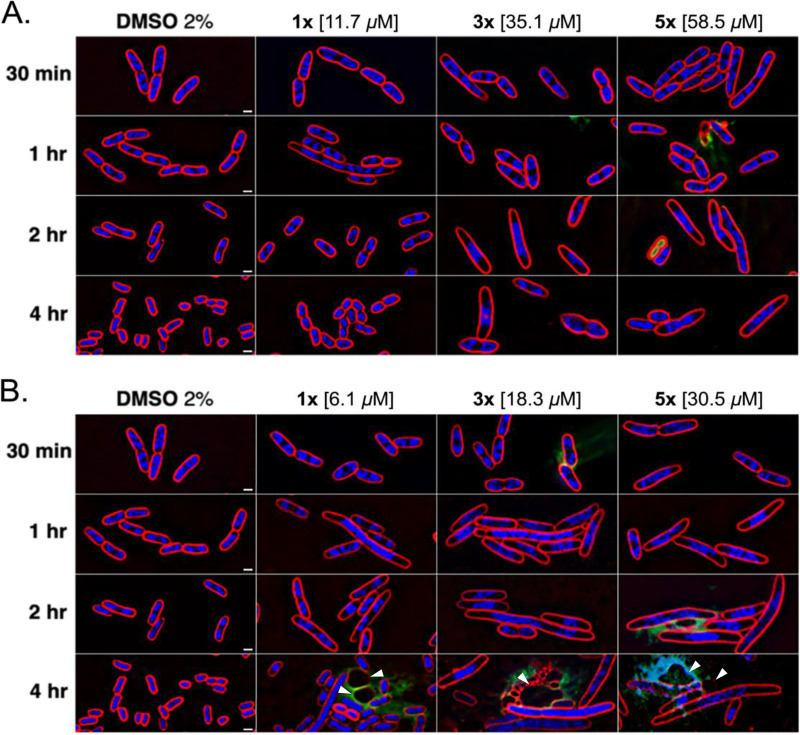
FIG 1.
Cytological profiles of the E. coli JP313 ΔtolC strain treated with two PAINS. Cells were exposed to compound 1 (A) or compound 2 (B) at 1×, 3×, and 5× MIC for 30 min, 1 h, 2 h, and 4 h. Images were taken after staining the cells with FM4-64 (red), DAPI (blue), and SYTOX-green (green). Arrowheads mark spheroplasts indicative of inhibited cell wall biogenesis. Scale bars, 1 μm.

