
Figure 1 .
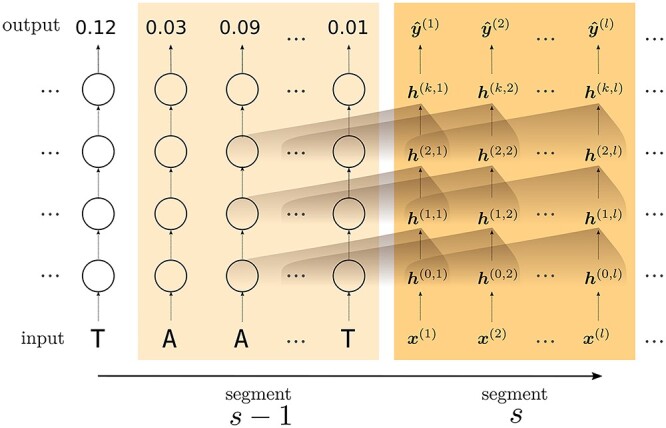
Illustration of the data flow within the transformer architecture. The full genome is processed in sequential segments  with length
  . First, the input nucleotide is transformed into a vector embedding
  , after which it is processed by
  consecutive residual blocks (
 ). A set of fully connected layers transforms
  into a model output
  . For the calculation at each residual block, the upstream
  hidden states of the previous layer are applied (brown gradient). For example, the calculation of
  is based on the hidden states
  ]. Hidden states from the previous segment (
 ) are made accessible for the calculation of the hidden states in segment
  .
.