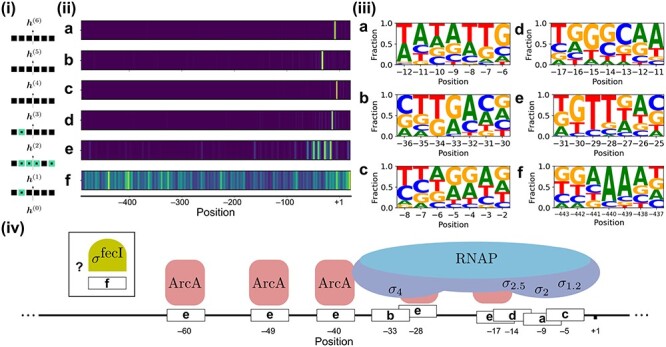
Figure 3 .

Examples of information extracted from the trained transformer network. (i) An illustration of the attention heads (squares) used to calculate the intermediary hidden states  within the model architecture. There are six attention heads for each layer. The green squares show the positions of the attention heads described here. (ii) For the six discussed attention heads, attention scores given to each of the 512 upstream hidden states are shown, averaged for 18 295 random positions on the genome (1% of the test set). Several attention heads are highly targeted based on positional information, showing high scores in yellow and low in blue. The scores are normalized for each attention head. (iii) For every attention head, sequence motifs were made based on the 50 highest scoring nucleotide sequences at the upstream position with the highest average score, illustrating the sequence information that returns high scores for each attention head. (iv) Based on the sequence and positional information from (ii) and (iii), a match exists that connects the focus of attention heads to the workings of known transcription factors involved in the transcription process.
