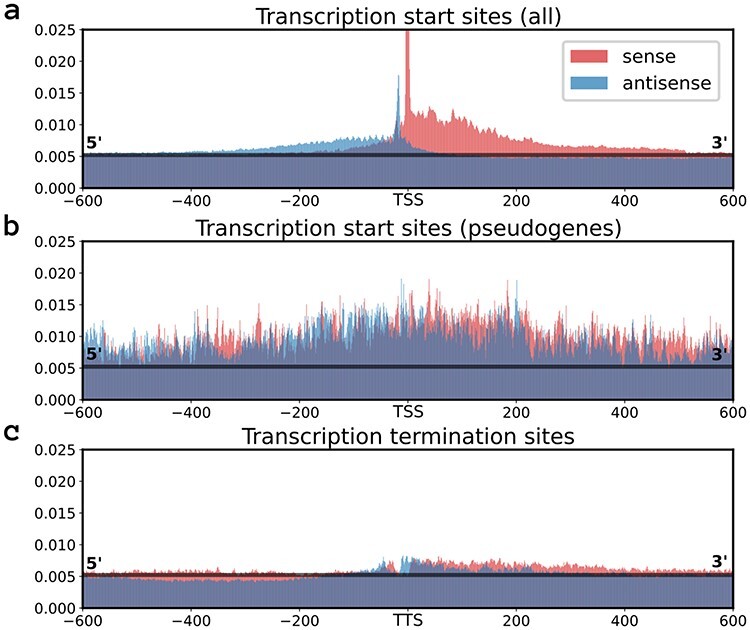
Figure 4 .

An overview of several plots that describe the prediction characteristics of the model. Data is obtained by the model trained and evaluated on the test set of the curated annotations. the median model output on the test set (0.053) is represented as a horizontal black line in (a,b,c). Each plot gives the median model output at each position within a 1201-nucleotide window centered on the site of interest. Displayed are the median model outputs for the positions around all the (a) Transcription Start Sites (TSSs), (b) the TSSs of genes annotated as pseudogenes and (c) all the transcription termination sites, obtained from Ju 
 . [18].
