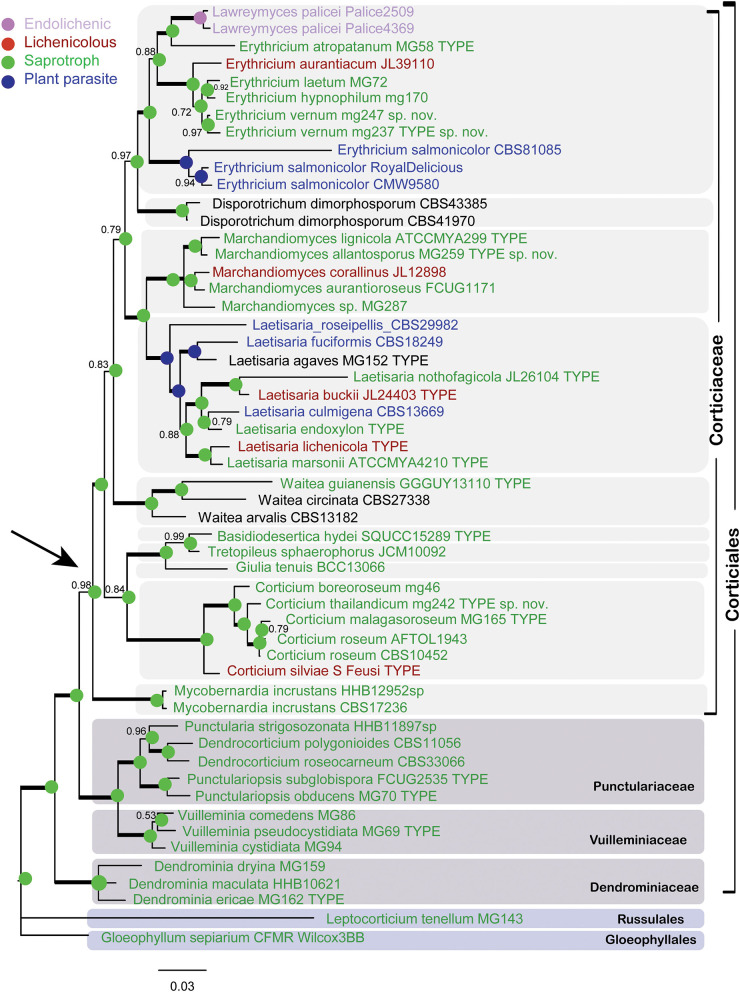
Figure 2.
Bayesian phylogram of the concatenated nLSU-ITS-SSU-mtSSU dataset for Corticiaceae. Clades for the Corticiaceae genera are marked with light gray boxes. Branches in bold have the posterior probability = 1.00. Taxa are colored according to their nutritional mode (taxa names in black have uncertain nutritional habit). The colored nodes show the ancestral character state inferred from parsimony analyses. The tree is rooted with Gloeophyllum sepiarium. The scale bar represents the expected changes per site.

