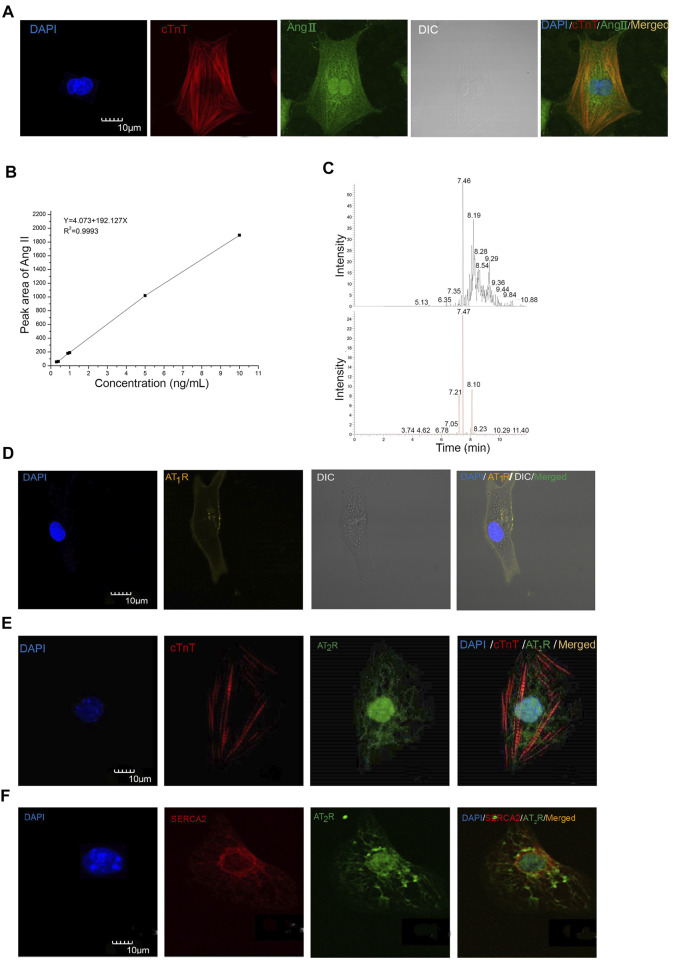
FIGURE 1.
Ang II, AT1R, and AT2R were detected in mESC-CMs and NRVMs. (A) Representative images showing the immunocytochemistry of iAng II in mESC-CMs. Cells were immunostained for cTnT (red), Ang II (green), and the nucleus with DAPI (blue). The results indicated that Ang II was present in mESC-CMs. (B) Linear calibration curve of Ang II. (C) Analysis of the NRVM samples by UHPLC-ESI-MS/MS. The extracted ion chromatograms of the two kinds of MRM. The upper one is the 523.8 ± 0.1 m/z →263.1 ± 0.1 m/z; the lower one is the 523.8 ± 0.1 m/z →784.4 ± 0.1 m/z. (D) mESC-CMs were transduced with the vector carrying AT1R-YFP and were stained with DAPI (blue). AT1R-YFP signals were detected on the plasma membrane. (E, F) mESC-CMs were stained with DAPI (blue), anti-AT2R (green), and (E) anti-cTnT (red) or (F) anti-SERCA2 (red). Merged images revealed extensive co-localization of AT2R with the nucleus and the SERCA2, suggesting that AT2R was located predominately on the nucleus and the SR. Scale bars represent 10 μm.

