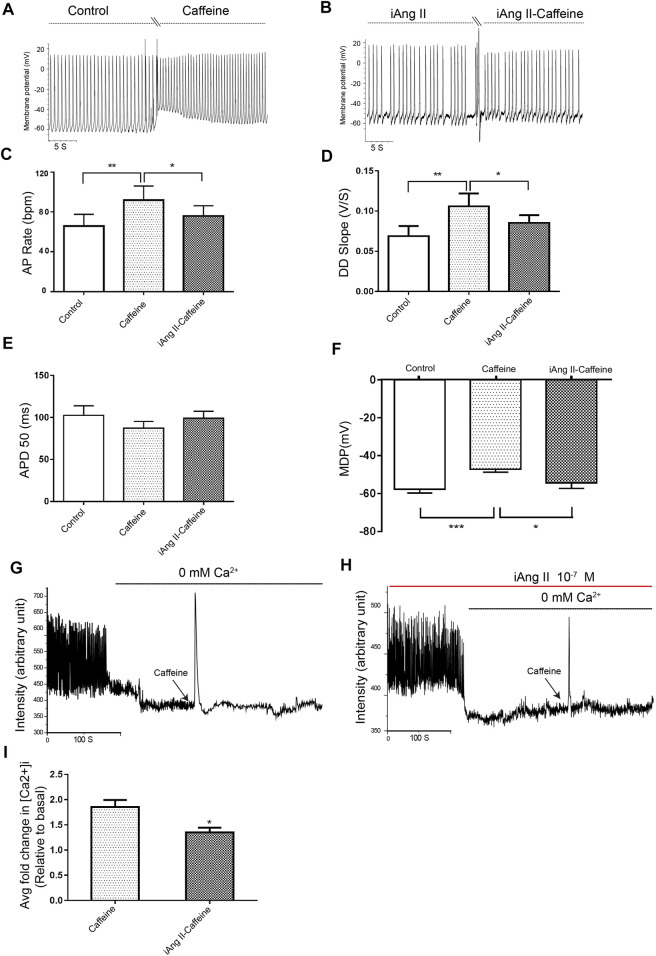
FIGURE 6.
iAng II attenuated caffeine-induced changes of APs and caffeine-induced Ca2+ release in mESC-CMs. (A) Raw traces of spontaneous APs at the basal level and upon treatment with caffeine (5 μM) in mESC-CMs. (B) Raw traces of spontaneous APs upon treatment with iAng II (10–7 M) followed by the subsequent application of caffeine in mESC-CMs. (C–F) Summarized data on the (C) AP rate, (D) DD slope, (E) APD50, and (F) MDP upon treatment with caffeine (5 μM) alone or upon treatment with iAng II (10–7 M) followed by caffeine (5 μM). (G) Raw traces of changes in Fluo-4 fluorescence at the basal level and upon treatment with caffeine (5 μM) in mESC-CMs. (H) Raw traces of changes in Fluo-4 fluorescence with caffeine in the presence of iAng II (10–7 M) in mESC-CMs. (I) Summarized data on the effects of iAng II (10–7 M) on the caffeine-induced Ca2+ release in mESC-CMs when external Ca2+ was absent. Values are mean ± SEM of 6–10 independent experiments. *p < 0.05 vs. control group.

