
Fig. 3.
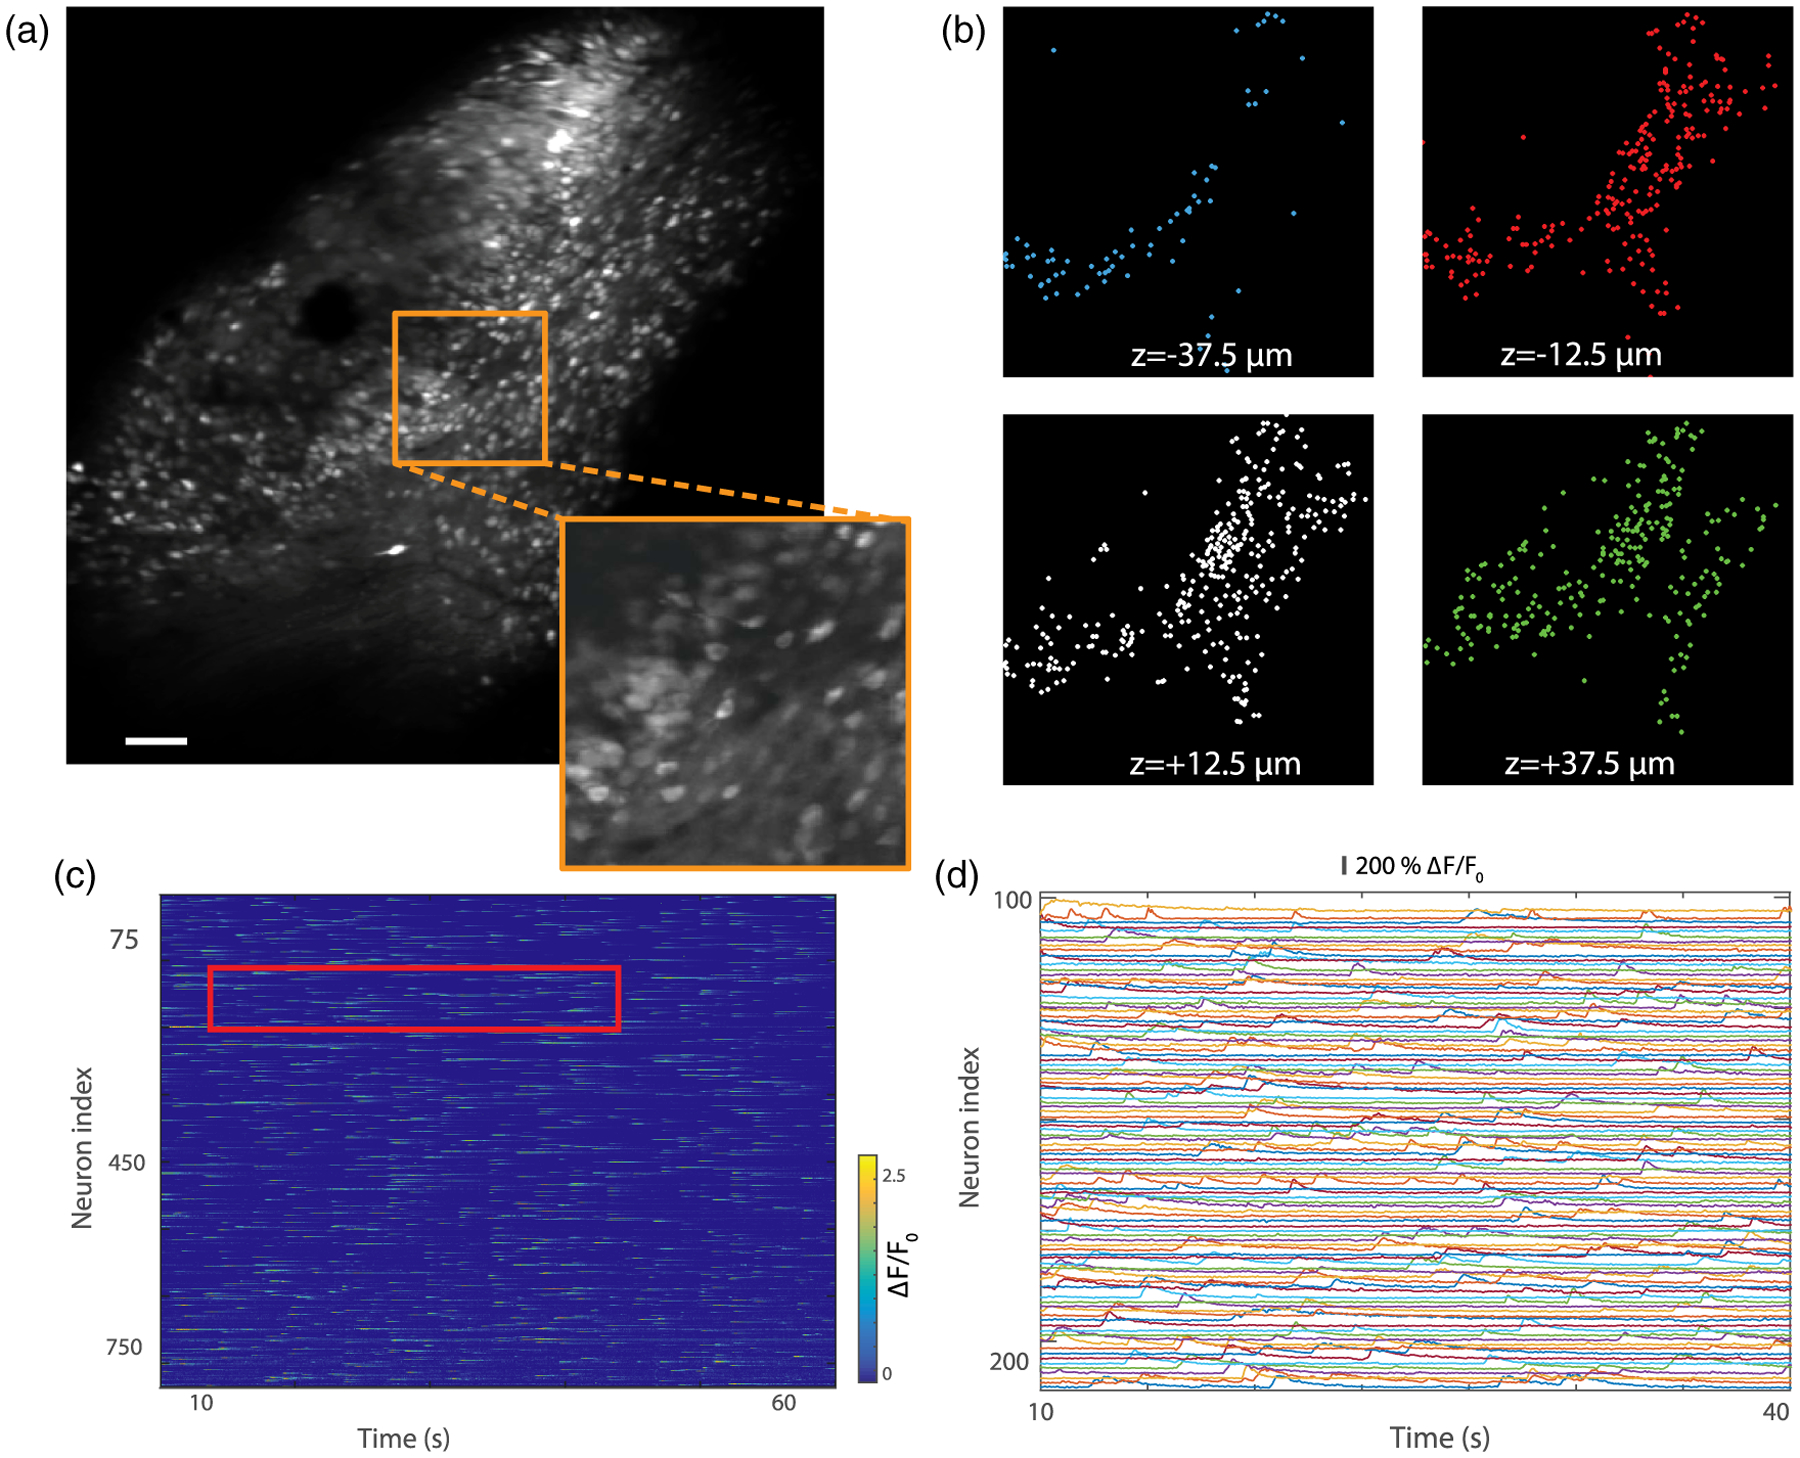
Video-rate volumetric Ca2+ imaging in mouse brain expressing GCaMP6f (note that viral injection here led to a labeled area somewhat smaller than our FOV). (a) Extended depth of field image recorded in the hippocampus at 30 frames per second and averaged over 20 s (see Visualization 3 for the video). 512 × 512 pixels; scale bar, 100 μm. Inset with 3 × zoom illustrates cellular resolution. (b) Identification of neurons in each image plane using constrained non-negative matrix factorization (overlay with Panel a is shown in Supplement 1). (c) Activity of the 826 neurons identified in (a). (d) Magnified view of the neuronal activity traces for the region indicated by the red rectangle in (c).