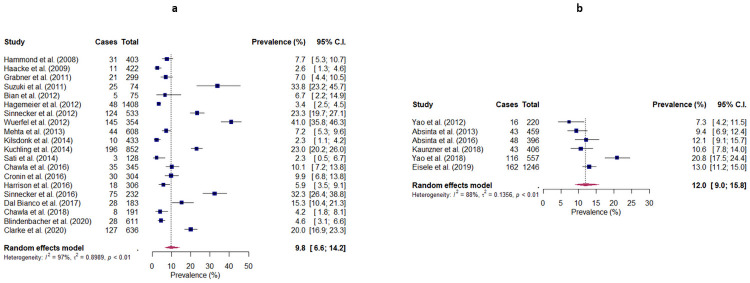
Fig 2. Random-effects forest plots showing the pooled lesion-level prevalence of (a) rim lesions and (b) chronic active lesions in patients with MS.
The lesion-level prevalence observed by each study is represented by a square, with the 95% confidence interval being represented by a horizontal line. The pooled lesion-level prevalence is represented by a diamond, with the width corresponding to the 95% confidence interval. Cases = Number of identified rim lesions/chronic active lesions; Total = Total number of lesions.

