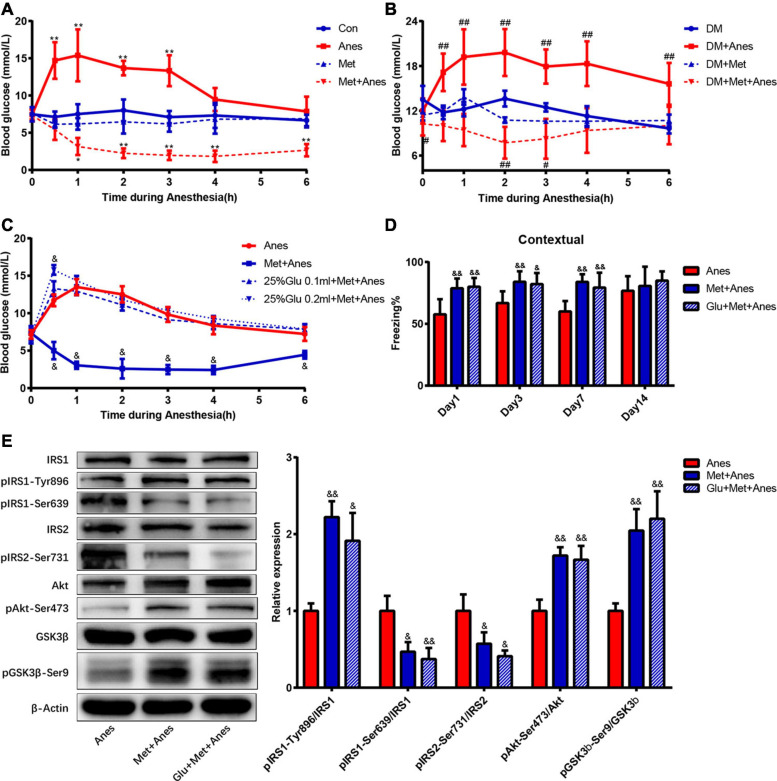
FIGURE 5.
Metformin improves hippocampal IR and contextual fear memory, independent of antiglycemic effects. (A,B) Changes in blood glucose levels during anesthesia among adult WT mice (A) and T2DM mice (B) with or without metformin pretreatment (n = 4–6). (C) Changes in blood glucose levels during isoflurane anesthesia among WT mice receiving pretreatment with vehicle (Anes), metformin (Met + Anes), 25% glucose 0.1 ml plus metformin (25% Glu 0.1 ml + Met + Anes), or 25% glucose 0.2 ml plus metformin (25% Glu 0.2 ml + Met + Anes) (n = 4 for each group). Blood glucose levels are expressed as mean ± SD and compared by repeated measures ANOVA followed by Bonferroni multiple comparisons tests. Repeated measures ANOVA revealed a significant effect of treatment in adult WT mice [F(3,18) = 84.091, P < 0.001] and T2DM mice [F(3,13) = 30.604, P < 0.001], as well as a treatment × time interaction [WT mice: F(18,45) = 3.281, P = 0.001; T2DM mice: F(18,30) = 2.149, P < 0.001]. There was also a marked effect of time in WT mice [F(6,13) = 8.552, P = 0.001], but not T2DM mice [F(6,8) = 2.534, P = 0.112]. Simple contrasts indicated administration of 25% glucose 0.1 ml or 0.2 ml to metformin-pretreated mice induced obvious hyperglycemia (both P < 0.001) and no substantial differences in blood glucose levels among Anes, 25%Glu 0.1 ml + Met + Anes, and 25%Glu 0.2 ml + Met + Anes group mice (all P > 0.05). (D) Freezing times to context by adult WT mice receiving vehicle, metformin, or 25% glucose 0.1 ml plus metformin (Glu + Met + Anes) prior to isoflurane anesthesia (n = 7–8). (E) Representative western blots (left panels) and densitometric analysis (right panels, n = 3 for each group) showing the effects of vehicle, metformin, and 25% glucose 0.1 ml plus metformin on the protein expression levels of hippocampal insulin signaling components in isoflurane anesthetized adult WT mice. Data of freezing conditional test and Western blots are expressed as mean ± SD and analyzed with one-way ANOVA test followed by Bonferroni multiple comparison test. ∗P < 0.05 and ∗∗P < 0.01 vs. Con group, #P < 0.05 and ##P < 0.01 vs. DM group. &P < 0.05 and &&P < 0.01 vs. Anes group.

