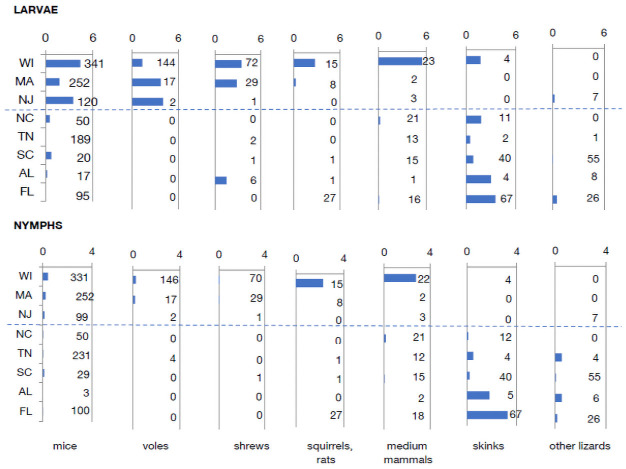
Fig 5. Latitudinal trends in tick numbers on hosts.
Mean number of ticks per individual animal in each category over the season. Numbers to the right of bars indicate the number of individual captured animals from which each mean was calculated. Dashed line divides northern from southern sites. Data are available in S8 Data.

