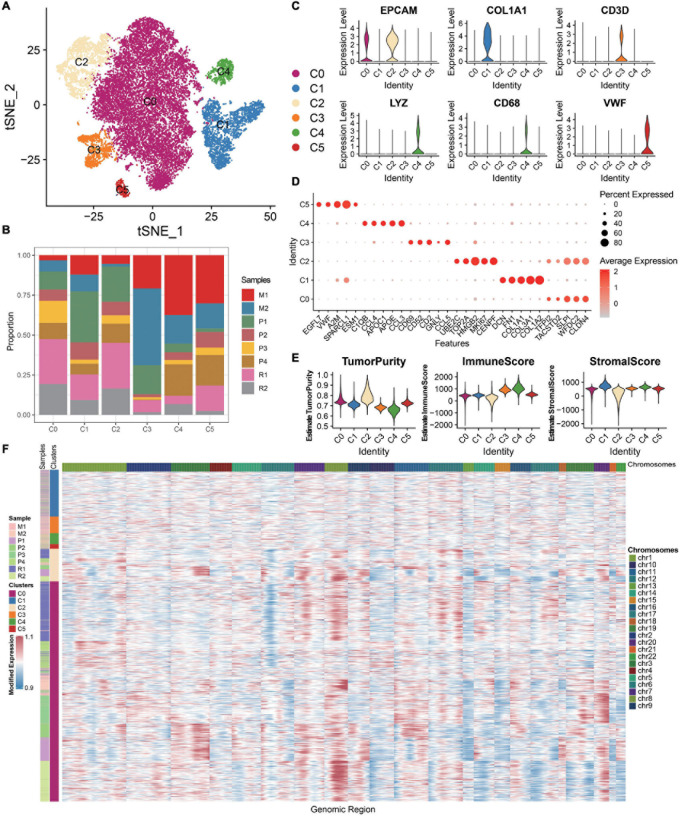
FIGURE 1.
ScRNA-seq profiling of the primary, metastatic, and relapsed OCs. (A) tSNE plot annotating six major cell types in OCs. (B) Histogram indicating the proportion of diverse cell types across different sample origins. (C) Violin plots exhibiting the expression of representative markers across diverse cell types. The y-axis was the normalized read count. (D) Dot plot showing the expression of the top five markers in each indicated cell types. (E) Violin plots illustrating the estimation of tumor purity, immune score, and stromal score across different cell types. (F) Chromosomal landscape of inferred large-scale CNVs distinguishing malignant epithelial cells from other cells.

